Stocks finished Tuesday lower despite an end-of-day surge, leaving the S&P 500 down roughly 70 bps, while the NASDAQ ETF QQQ fell by 1.8%.
The reason for the decline was not clear at the start. Eventually, it seemed attributable to Secretary Yellen’s headline-making talk about higher rates. Her remarks followed comments last week from the Dallas Fed governor talking about tapering.
If the “Fed” decides to drip out clues from different panelists every few days, it could be a long summer, ahead of an August Jackson Hole speech where Powell signals the tapering is ready to begin.
Simply put, the markets are not priced for tapering, nor are they priced for higher rates. Although tapering will come first, the bond market will begin to price-in higher rates well ahead of time, potentially even doing the Fed’s job. That means that strong economic growth will now become bad news for the stock market. With every better-than-expected headline, the cry for tapering and higher rates will only grow louder.
I say the market isn’t ready for this because the S&P 500 is trading at just about 21 times 18 months forward earnings. That multiple will need to contract a lot in the months ahead.
When we look back to 1998, we find that the path of that market rally seems to follow pretty well with today’s. Not just in terms of the path of the S&P 500, but in terms of the S&P 500’s 18-month forward PE ratio. The late 1990s was the last period that saw valuations that match the present. It would suggest that we are at the peak of multiple expansion and that from here forward, we are likely to see multiples contract

Even on an earnings yield basis versus those inflation rates everyone worries about, the market has only been more expensive one other time in the modern era.

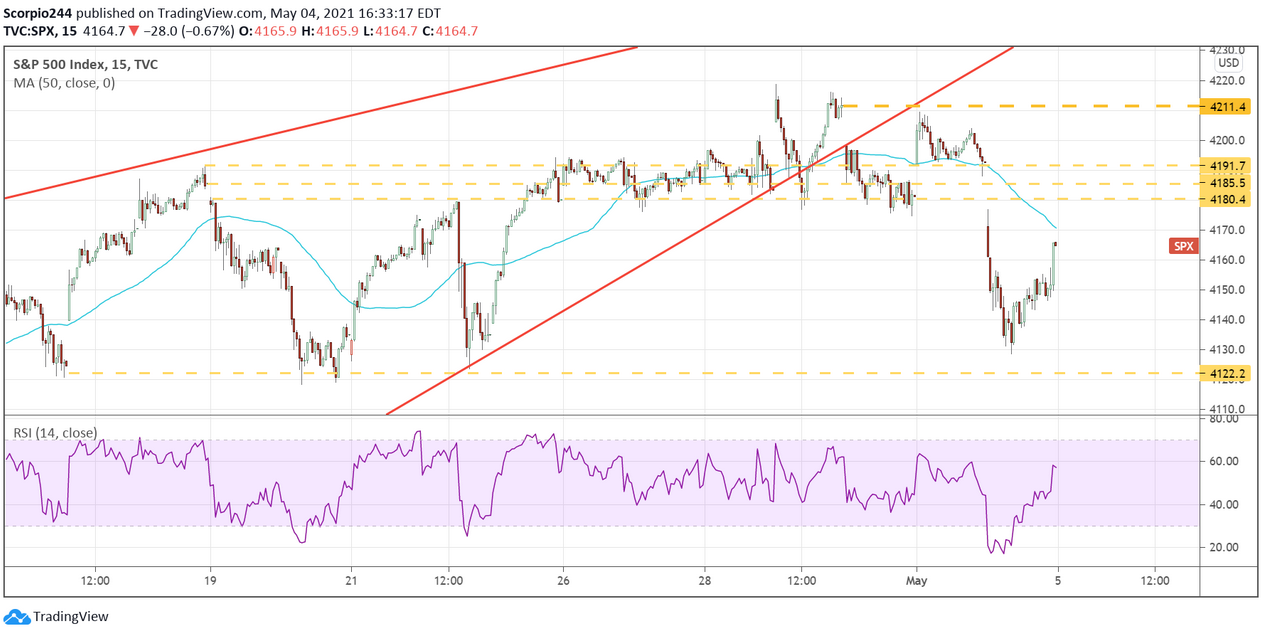
That said, the index fell to and tested support around 4,125, and it held. I wouldn’t be surprised to see the S&P 500 try and refill the gap from Tuesday morning at 4,180. I would think the index fails once it hits that level, just like it did Monday at 4,210.
If the index gaps lower later today, below 4,120, that will tell us much lower prices will follow.

Amazon
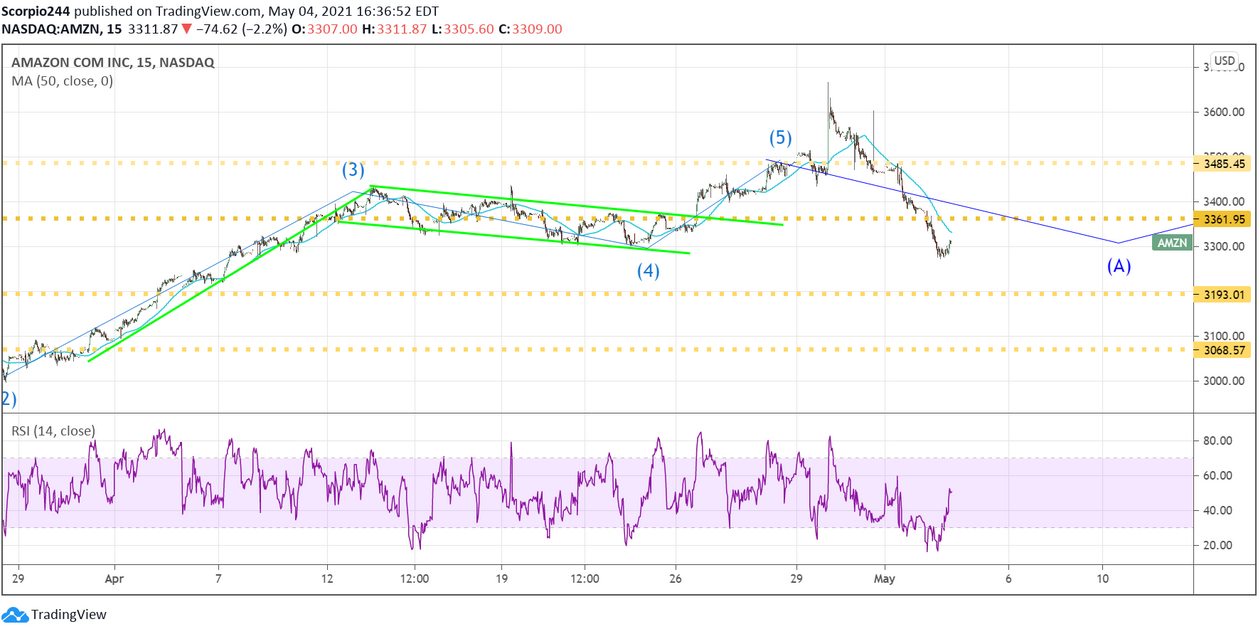
Amazon (NASDAQ:AMZN) fell again yesterday and is now down 10% from its after-hour highs last week. Pretty big move; I’m not sure where it goes from here.
I thought it would stop at $3,360 and at least find a dead cat bounce; maybe it finds that bounce at $3,200.

Square
Square (NYSE:SQ) was crushed yesterday, probably because Bitcoin was crushed. Anyway, Square broke some key support at $244. It probably has further to fall to the gap fill at $210.
Acadia
ACADIA Pharmaceuticals(NASDAQ:ACAD) reports results today, but I have no clue what shall happen. Apparently, no one else does either, based on what's transpired over the past month.
If they requested a “Type A” meeting with the FDA as soon as they got the CRL, or on April 5, then 30 days would put the meeting no later than yesterday, May 4. Did that meeting take place? Will we hear news? The company did note today they will be participating in a upcoming conferences.
I’m trying to read the tea leaves and hoping for the best. I think just about everyone is. I don’t see why Acadia would want to participate in anything at the moment, given every question would center around the CRL.
By the way, anybody read the ADCOM Panel meeting since 2016? You should a lot of questions for today get answered then.
Bitcoin
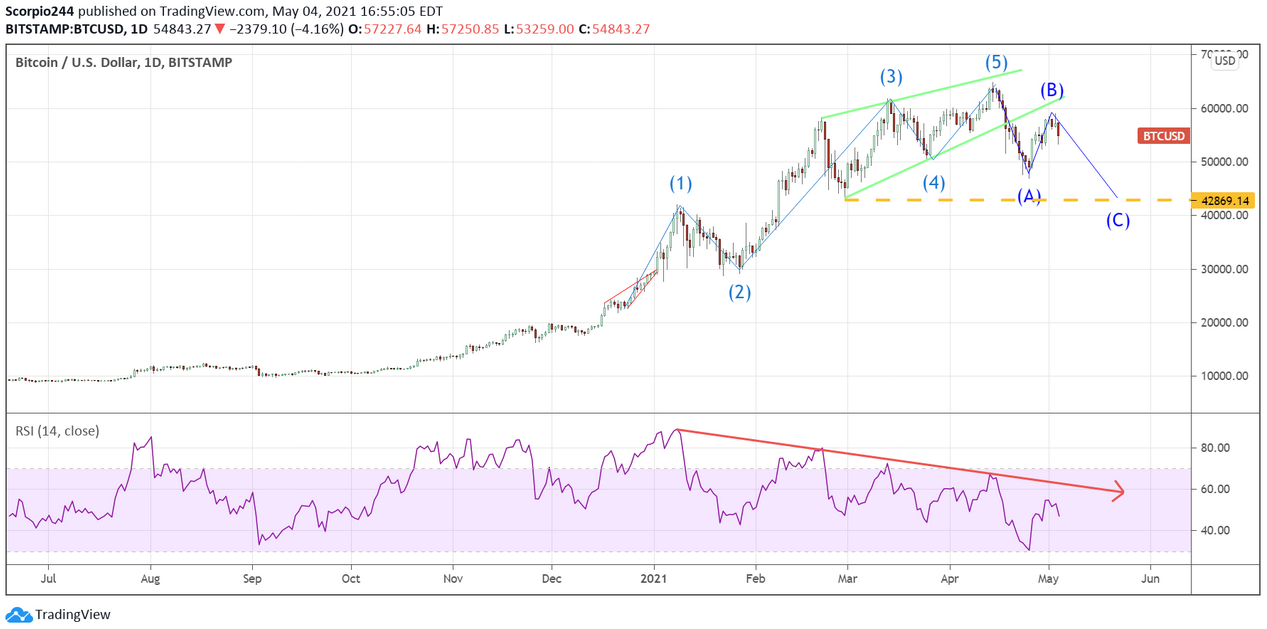
I still think Bitcoin is heading to 43,000. Since it trades with no fundamentals, nor any reason, it sounds like a good level to me.

