The last 6+ trading days before the US elections could result in a confirmation of last month’s SPY Dark Cloud Cover pattern or a potential Harami pattern setup. What does this mean for traders and investors?
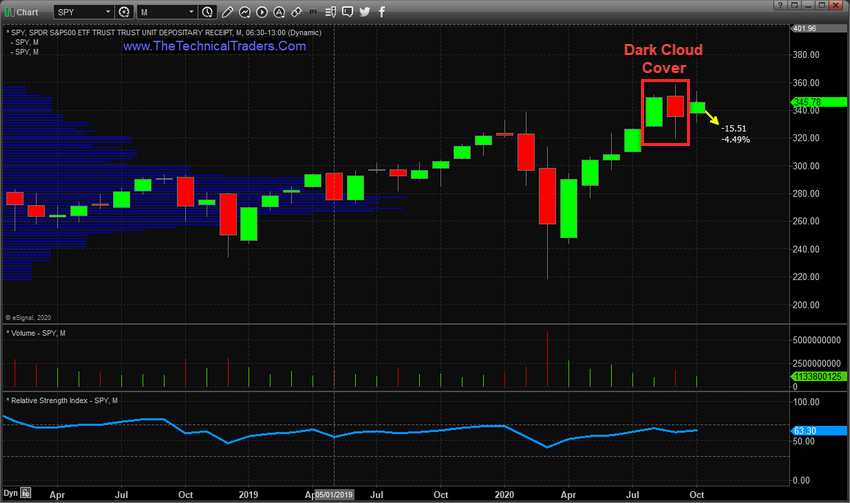
The Dark Cloud Cover pattern is a very ominous potential Top/Sell trigger in Japanese Candlestick terms. It is a fairly common pattern, like the Engulfing Bearish pattern, that manifests near major peaks in price. The one thing that really stuck out with the current Dark Cloud Cover pattern on the Monthly SPY chart was the size of the pattern. The current Dark Cloud Cover pattern on the Monthly SPY chart spans 39.56 points (nearly an 11% price range). Comparatively, this pattern is very large compared to the more recent price peak ranges.
Over the past 30+ days, we’ve published multiple research articles related to the core technical elements of the SPY chart and the Dark Cloud Cover pattern that set up in September. Pay very close attention to the Fibonacci Price Amplitude Arcs that also show key resistance playing out near the recent peaks. Finally, don’t forget to read our Grey Swan Alert in October’s issue of TradersWorld.
At this point, the SPY needs to decline by 3.5% to 4.5% from current levels to confirm the Dark Cloud Cover pattern. This represents a price decline of only about 11.00 to 15.00 overall over the next 5 days. We believe this is a very important price trigger setup for technical traders. If this setup does confirm, then we would be very concerned that deeper downside price trends may continue after the US elections.
MONTHLY SPY DARK CLOUD COVER SETUP
The Dark Cloud Cover pattern, in this instance, is excessively large compared to previous setups and strongly suggests a major price peak may have already set up in the US stock market. This may translate into a new price trend/cycle that many traders are completely unprepared for. This SPY Monthly chart below highlights the Dark Cloud Cover pattern and what we believe is needed to confirm this pattern. Any extended selloff over the next 5+ days could either confirm this pattern or setup a Harami pattern, which also warns of a price reversal.

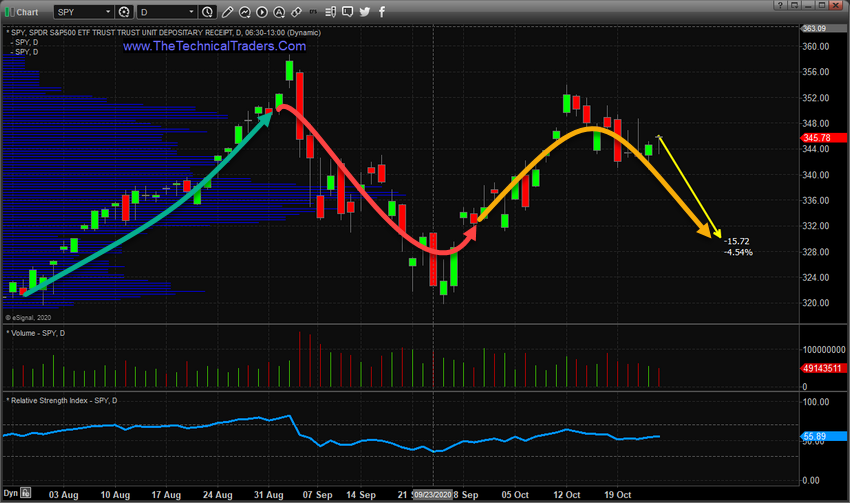
DARK CLOUD COVER ON THE DAILY SPY CHART
Interestingly, the Dark Cloud Cover setup on the Daily chart represents a very clear change in price trend. In order for the Dark Cloud Cover pattern to form, a strong bullish price trend must initially setup the rally to highs. This trend suddenly changes and a deep price correction sets up the “close below the midpoint of the real Body” – creating the Dark Cloud Cover pattern. Once this is set up, we are just waiting for “confirmation” – which is often identified as a lower high, lower low, and lower close on the following candle.
Our research team believes that any continued selling in the SPY over the next 5+ days could prompt confirmation of the Monthly SPY Dark Cloud Cover pattern – as shown on the Daily SPY chart below. We believe the transitional shift of capital before the US elections and the lack of market liquidity may prompt a moderately strong downtrend over the next few days leading into the US elections. If the Dark Cloud Cover pattern does confirm, skilled traders need to prepare for more potential market weakness after the elections.

All it takes at this point is a moderate 3.5% to 4.5% downside price move in the SPY to confirm this massive Dark Cloud Cover pattern. The size of this pattern is 400% to 600% larger than the price range peaks in 2000 and 2008, and is nearly 30% larger than the entire trading range between 2015~2016 (the two years prior to the 2016 US elections). That range comparison, alone, should shock skilled technical traders. A two-month Japanese Candlestick pattern includes a price range which is warning of a potential massive top in the markets AND that pattern is larger than the incredibly volatile trading range spanning more than 24 months between 2015 to 2016.
If you are having any trouble comprehending this range comparison, think of it this way… the current price range suggests that one month’s trading range is 100% to 300%+ larger than a full 12 months trading range prior to 2017. It is massive in comparison to historical ranges. This suggests we may see a very volatile price rotation over the next 12 to 24+ months in the US and global markets. One way or another, volatility is here and we better get used to it.
