Get 40% Off
👀 👁 🧿 All eyes on Biogen, up +4,56% after posting earnings. Our AI picked it in March 2024.
Which stocks will surge next?
Unlock AI-picked Stocks

Stocks Are Close To A Massive Break Out

Published 10/09/2020, 01:43 AM
Updated 09/20/2023, 06:34 AM

S&P 500

Stocks were higher yesterday, with the S&P 500 finishing up about 80 basis points to close at 3,446. The market managed to gap higher above the 3,425 level, advancing to 3,445. It’s an essential level of resistance. It’s the Fibonacci 61.8% retracement level from the Sept. 2 highs to the Sept. 24 lows. It could be one reason why we were kind there all day and were unable to advance.

The market is in an interesting spot because it is trying to break out of a trading range. However, we really need to see a strong follow-through on Friday, Oct. 9, to confirm that we are breaking out and likely to head higher back to the 3,560 level.

At this point, I don’t have enough evidence to support that notion. However, if we have a higher day again today, we can begin to look for higher prices.
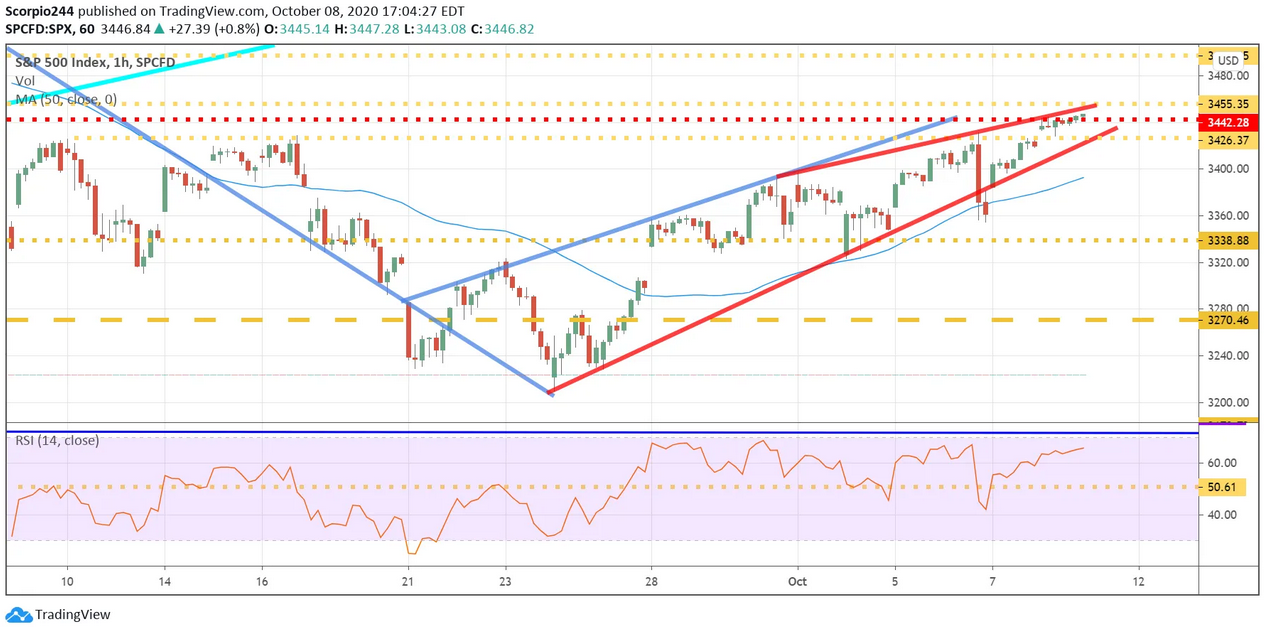
S&P 500 Index Daily Chart

NASDAQ 100

The NASDAQ 100 (NASDAQ:QQQ) wasn’t as successful yesterday; it actually finished the day right below technical resistance at $282. This is a crucial level of resistance that dates back to Sept. 9. It was almost the equivalent of the resistance level in the S&P 500 at 3,425.

However, if the Qs cannot penetrate that $282 level, it would leave the question open as to whether or not the S&P 500 actually broke out today. It could just as quickly turn out to be a failed breakout when we start trading tomorrow.
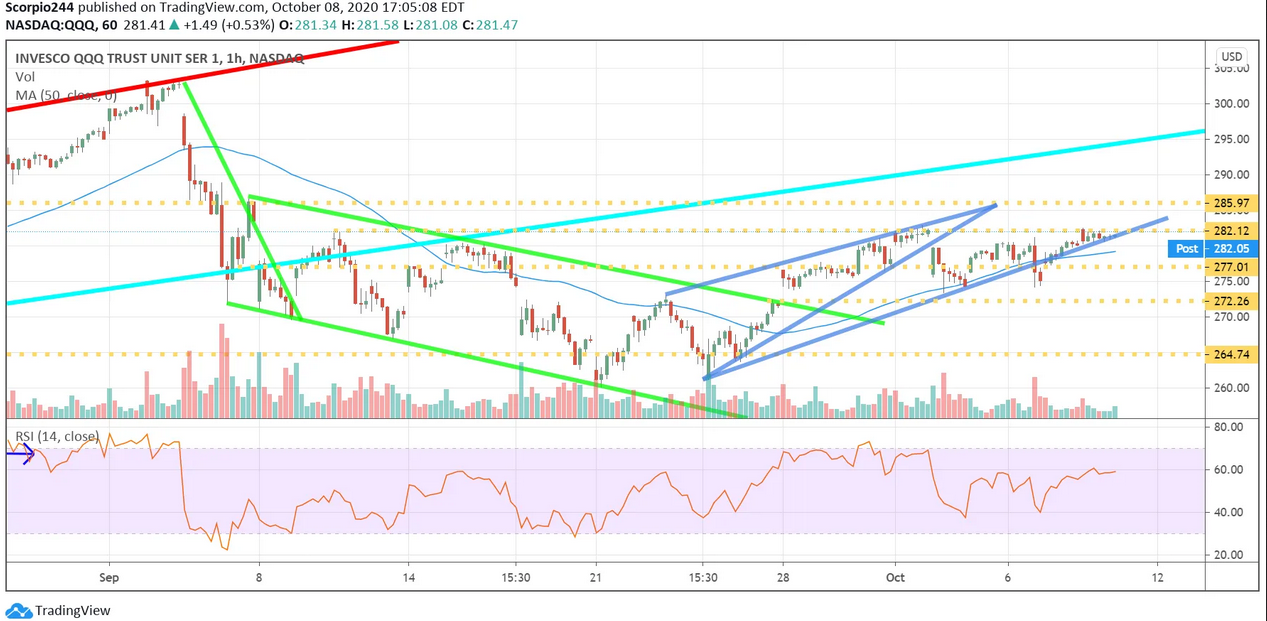
QQQ 1 Hour Chart

Apple

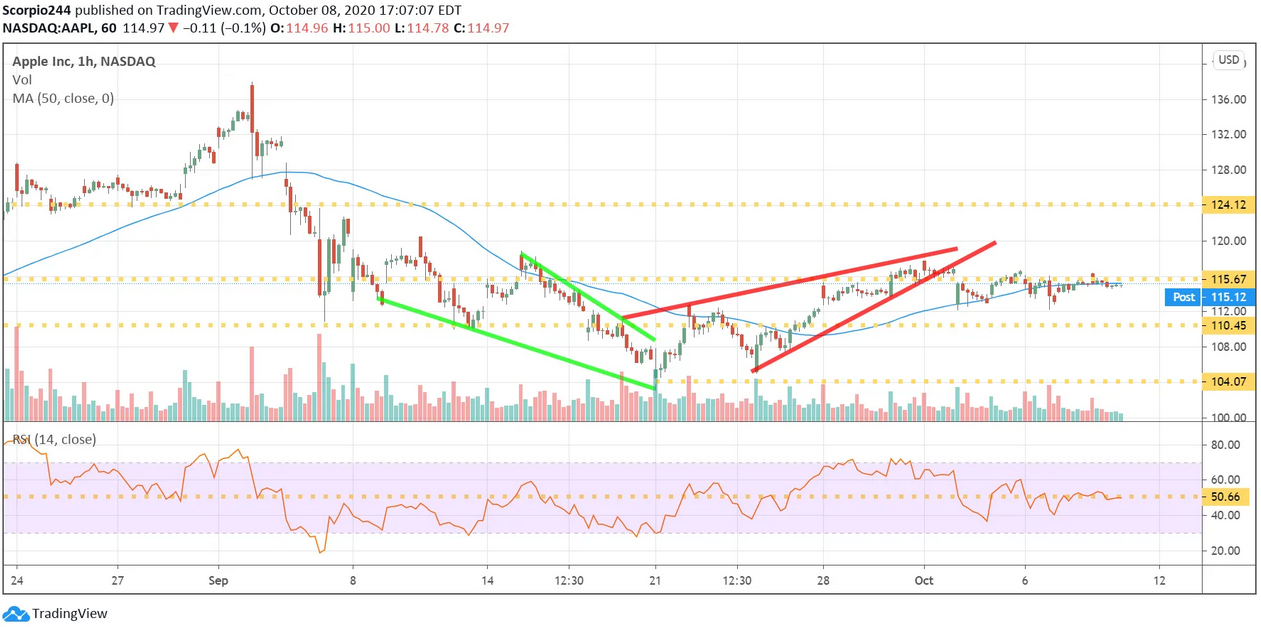
It wasn’t a great day for Apple (NASDAQ:AAPL) with the shares trading sideways, and finishing the day lower by 10bps. The stock is just stuck at resistance, and it is hard to imagine the market moving significantly higher without Apple. I just don’t see Apple breaking out yet. Not based on what I have seen in recent days.
3rd party Ad. Not an offer or recommendation by Investing.com. See disclosure here or remove ads .

Apple Inc 1 Hour Chart

{0|Amazon}}

Amazon (NASDAQ:AMZN) didn’t rally yesterday either. Again, it is going to be hard for the market to rally much without Amazon also.
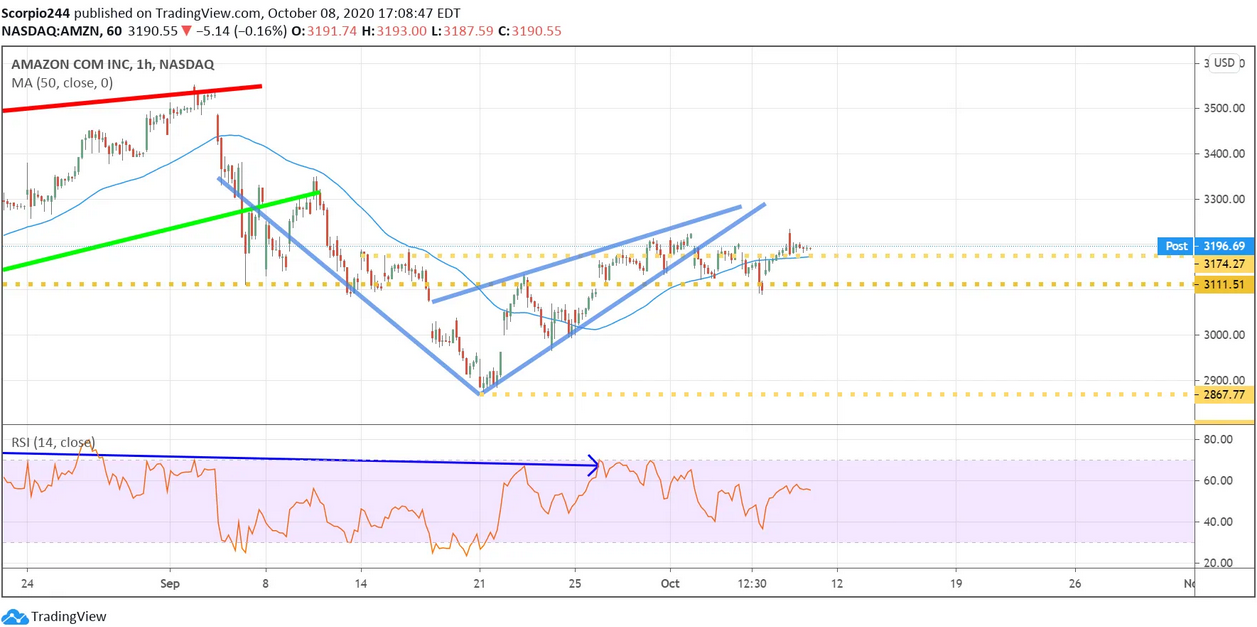
Amazon Inc 1 Hour Chart

Intel

Intel (NASDAQ:INTC) is starting to break out and is now moving beyond resistance at $52.20. The RSI is picking up momentum, which means the stock is likely heading back to $56, with the potential for a gap fill at $60.
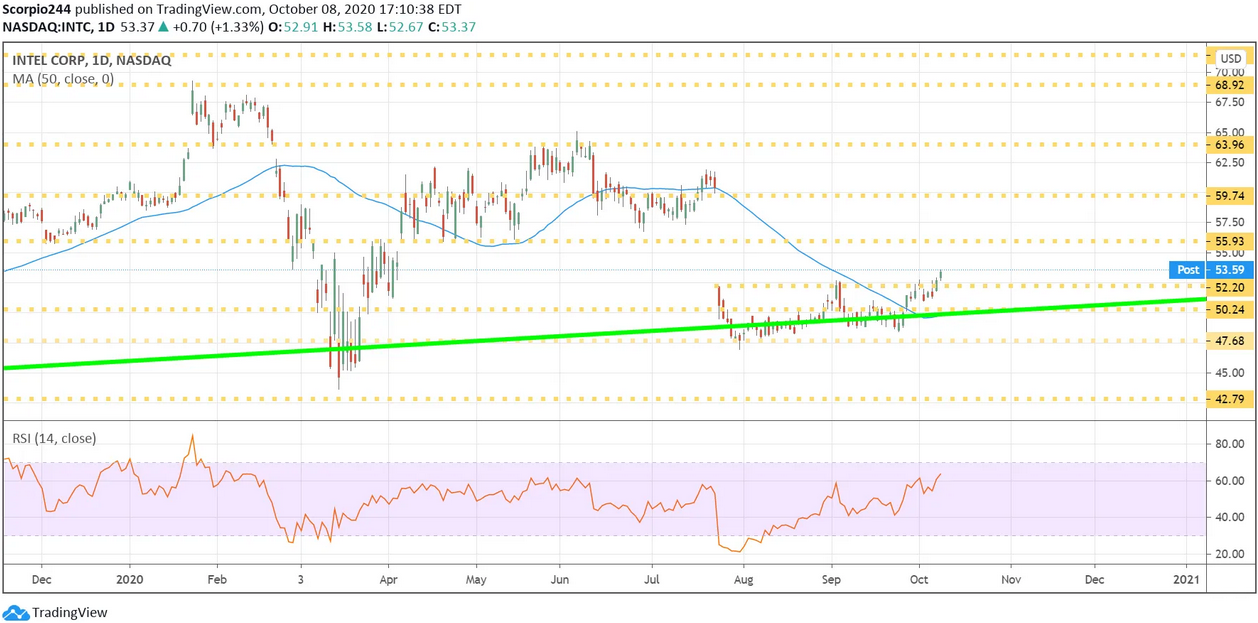
Intel Corp Daily Chart

Original Post

Latest comments

Must have been a typo, massive breakdown
The Market Cap to GDP ratio is at 182 all time high. (135 is considered overvalued) Fed data shows institutional lending standards have tightened to the same levels at after the GFC (Credit contraction). Hedge funds have the largest short position on treasury bonds in history. This would create a monster short squeeze on teasury notes.I dont care if people lose or make money but if you think this market is fair value then I'd like to hear an intelligent reason why.
assets but there are no returns to be had anywhere and stimulus has a way of finding itself in high risk assetts.
The $RUT and the equal weight S&P snd tech indices have blown through all weak resistance levels. While the SPX and NDX cannot advance without megacaps, there is plenty of money to be made in a rotation out of the megas. But while I key more on price vs volume, the low volumes on recent up days does have me concerned that we’re in a bull trap.
Thank you!
you're positive after a long time. Let's see
Iwm
Risk Disclosure: Trading in financial instruments and/or cryptocurrencies involves high risks including the risk of losing some, or all, of your investment amount, and may not be suitable for all investors. Prices of cryptocurrencies are extremely volatile and may be affected by external factors such as financial, regulatory or political events. Trading on margin increases the financial risks.
Before deciding to trade in financial instrument or cryptocurrencies you should be fully informed of the risks and costs associated with trading the financial markets, carefully consider your investment objectives, level of experience, and risk appetite, and seek professional advice where needed.
Fusion Media would like to remind you that the data contained in this website is not necessarily real-time nor accurate. The data and prices on the website are not necessarily provided by any market or exchange, but may be provided by market makers, and so prices may not be accurate and may differ from the actual price at any given market, meaning prices are indicative and not appropriate for trading purposes. Fusion Media and any provider of the data contained in this website will not accept liability for any loss or damage as a result of your trading, or your reliance on the information contained within this website.
It is prohibited to use, store, reproduce, display, modify, transmit or distribute the data contained in this website without the explicit prior written permission of Fusion Media and/or the data provider. All intellectual property rights are reserved by the providers and/or the exchange providing the data contained in this website.
Fusion Media may be compensated by the advertisers that appear on the website, based on your interaction with the advertisements or advertisers.
© 2007-2024 - Fusion Media Limited. All Rights Reserved.