June's AI-picked stock updates now live. See what's new in Tech Titans, up 28.5% year to date.Unlock Stocks

Stocks Are At A Crossroads As H2 Begins

Published 07/01/2020, 12:42 AM
Updated 09/20/2023, 06:34 AM
XAU/USD
-
US500
-
INTC
-
FCX
-
GC
-
HG
-
ZM
-

Tuesday was another bullish day for stocks, that was aided by a massive $5.3 billion to buy on the closing cross. It sent the index sharply higher in those final minutes. Still, one has to wonder what the trend will be as we enter the second half of the year. As of today, the downtrend from the early June highs is still in place. Also, the RSI is pointing lower. We need to see the S&P 500 break above the downtrend and resistance at 3,115, to get a push higher. For now, that will be the most critical level to watch for the index.
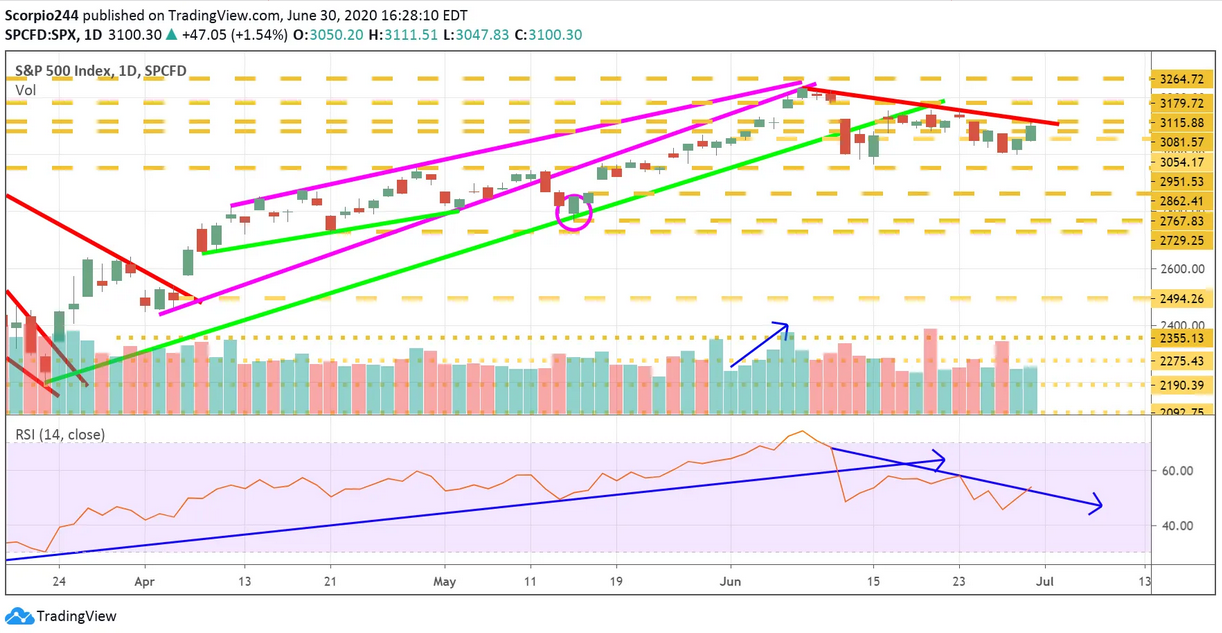
S&P 500 Index - Daily Chart

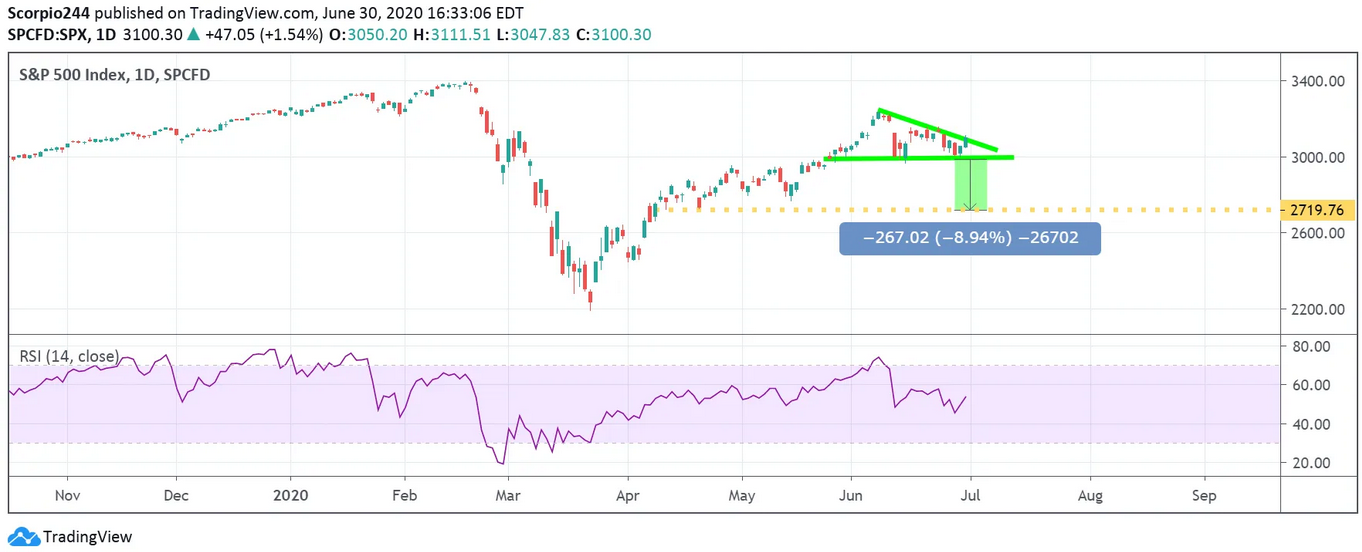
From another viewpoint, the chart I pieced together over the weekend, the one with the descending triangle. It is still in play, so the rest of this week could be interesting. I’m not quite sure how it will play out at this point.
SPX Daily Chart

It seems we are crossroads for the S&P 500, break above 3115, and we likely rocket back to the June highs. Fall below 2990, and we return to May lows. It seems fitting that we get all this critical economic data this week.

Let us hope it goes better than Chicago PMI did today; it was a horrid 36.6, which was worse than expected for 44.5. If the ISM comes that weak tomorrow it will not be a good day for stocks. Expectations are for 49 on tomorrow’s ISM manufacturing report.

Gold

Gold had a good day and is on the verge of a massive break out, which could send it back to its all-time highs, around over $1900.
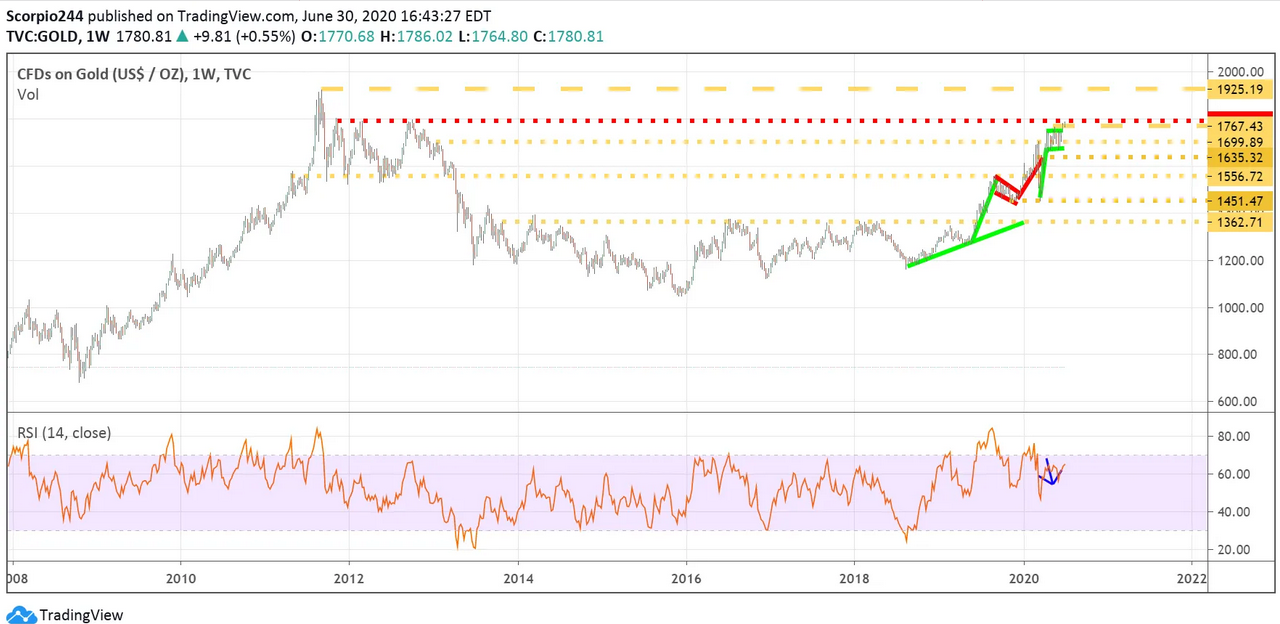
CFDs On Gold Weekly Chart

Zoom

Zoom Video Communications (NASDAQ:ZM) continues to look reasonably weak here. It did rebound some, but I’m not a fan, and the rising wedge is the prominent force with a decline to $225 still on the horizon.
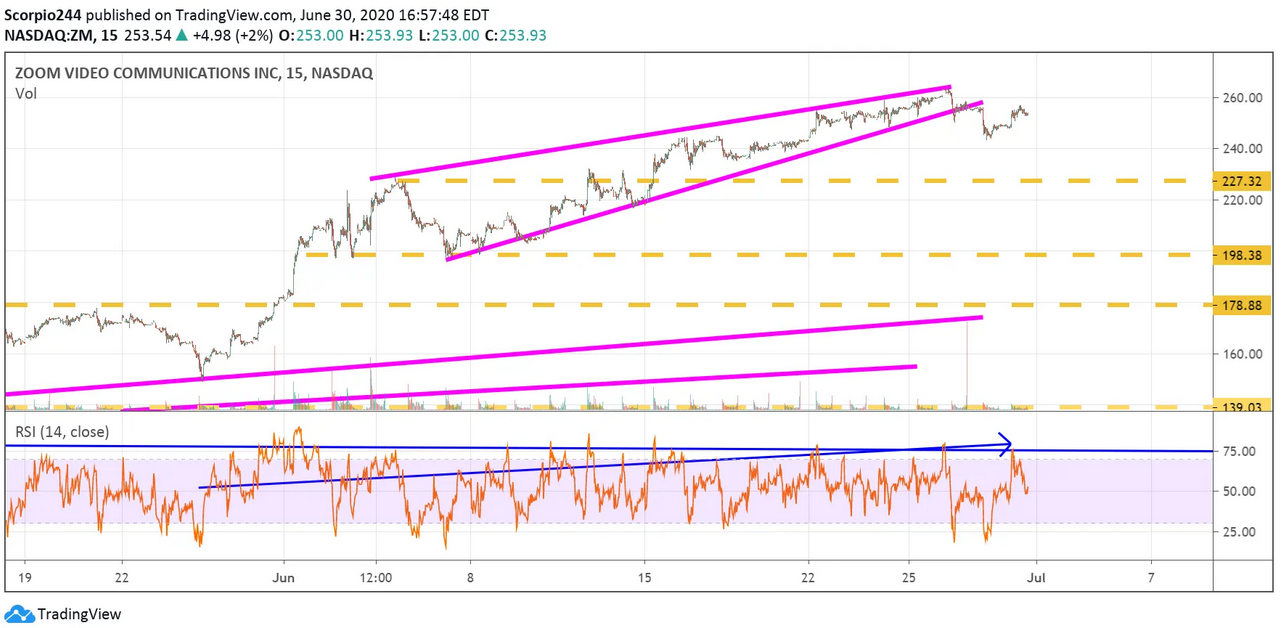
Zoom Video Communications Chart

Freeport 

Freeport-McMoran Copper & Gold (NYSE:FCX) may still have some further to rise, especially with the surge in copper price. There is a gap to fill around $12.05.

Freeport Inc Daily Chart

Intel

Intel (NASDAQ:INTC) is testing resistance at $59.75, with the potential for shares to push higher to $64.
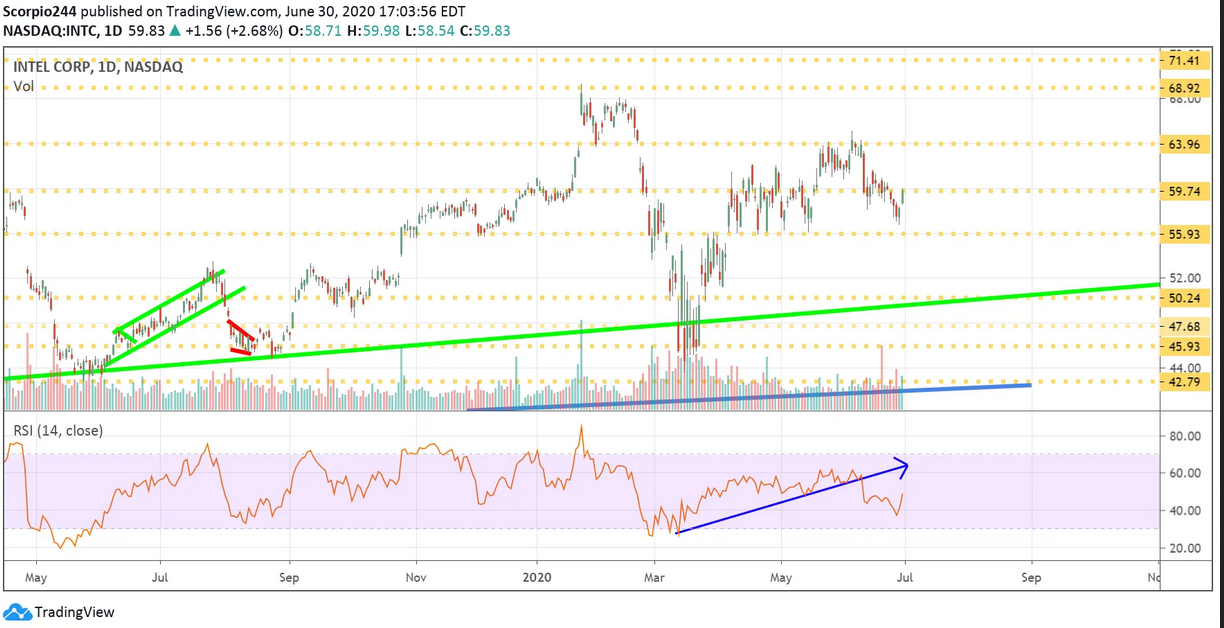
Intel Corp Daily Chart

Latest comments

Loading next article…
Risk Disclosure: Trading in financial instruments and/or cryptocurrencies involves high risks including the risk of losing some, or all, of your investment amount, and may not be suitable for all investors. Prices of cryptocurrencies are extremely volatile and may be affected by external factors such as financial, regulatory or political events. Trading on margin increases the financial risks.
Before deciding to trade in financial instrument or cryptocurrencies you should be fully informed of the risks and costs associated with trading the financial markets, carefully consider your investment objectives, level of experience, and risk appetite, and seek professional advice where needed.
Fusion Media would like to remind you that the data contained in this website is not necessarily real-time nor accurate. The data and prices on the website are not necessarily provided by any market or exchange, but may be provided by market makers, and so prices may not be accurate and may differ from the actual price at any given market, meaning prices are indicative and not appropriate for trading purposes. Fusion Media and any provider of the data contained in this website will not accept liability for any loss or damage as a result of your trading, or your reliance on the information contained within this website.
It is prohibited to use, store, reproduce, display, modify, transmit or distribute the data contained in this website without the explicit prior written permission of Fusion Media and/or the data provider. All intellectual property rights are reserved by the providers and/or the exchange providing the data contained in this website.
Fusion Media may be compensated by the advertisers that appear on the website, based on your interaction with the advertisements or advertisers.
© 2007-2024 - Fusion Media Limited. All Rights Reserved.