Get 40% Off
👀 👁 🧿 All eyes on Biogen, up +4,56% after posting earnings. Our AI picked it in March 2024.
Which stocks will surge next?
Unlock AI-picked Stocks

Stocks And Bonds: Resistance Circa 2000/07

Published 01/03/2019, 04:00 PM
Updated 07/09/2023, 06:31 AM

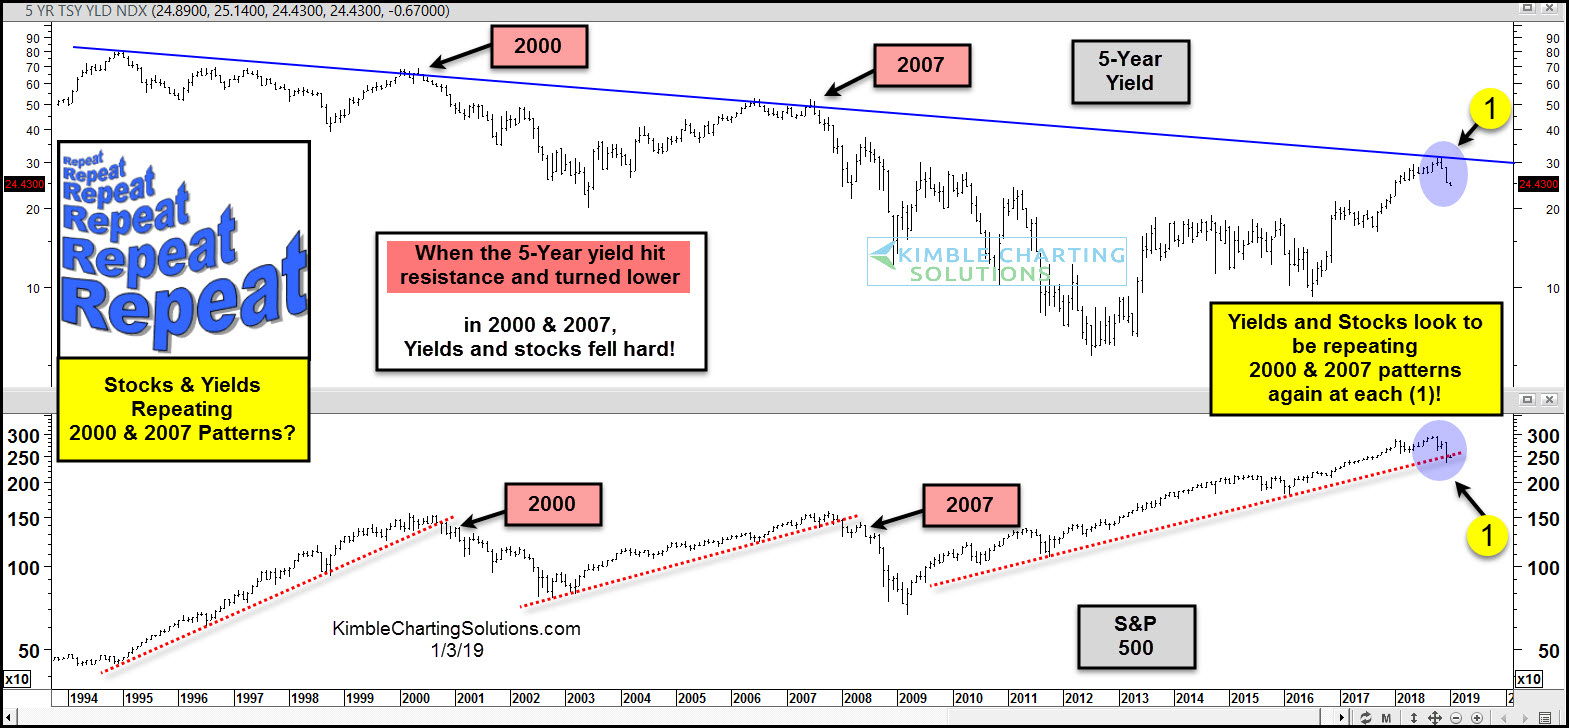
5-Year U.S. Treasury Yield (top), S&P 500

This chart overlays the S&P 500 and the yield on the 5-year note over the past 25 years.

When yields hit falling resistance in 2000 and 2007, they fell hard and stocks did too (50% S&P 500 declines).

Yields hit 20-year falling resistance a couple of months ago at (1) and they are turning lower and stocks are following along.

The current pattern in stocks and yields looks to be repeating the 2000 and 2007 patterns.

Will the results be different this time?

Latest comments

Why for the current bull market did you not start the trend line from the bottom? The previous 2 bull markets you have the trend line starting from the low. For the current one you didn't start from the 2009 low and draw out the trendline. I have seen a couple of other people do this recently and so I went and looked for myself and saw that actually if starting from the 2009 low and doing the trendline from there then 2011 correction broke it and the 2016 correction actually broke down through but became a false positive. 2016 correction actually broke the old trendline of the bull market. Since 2016 became another false prediction of recession people are now drawing trendlines including 2016 as a base point whereas at the time it actually broke the trendline. Everyone was screaming recession then and they were wrong and were wrong in 2011. If wrong again this time then the trendline will just be drawn yet again for the next time everyone gets bearish and screams recession.
I see what you are saying, and I agree. However, a certain amount of subjectivity can be applied to technical analysis, which is, to a degree, a creative art. . . I think the credit crunch was a different beast to other recent bear markets, it was brutal, and widespread, and is represented by the steepness of the decline on the chart, where the bottom is ultra extreme, and is like an inverse of a stock that goes parabolic on the upside before collapse. Despair and an 'End of the World' psychology pervaded at the time, in a way that was not quite the same for other recent bear bottoms. . . Taking this into account, I think it is probably justified to use the later bottoms as a support line, to provide a more accurate representation of the general psychology of the market working within normal market conditions. I would posit that the credit crunch bottom is an anomaly, as long as those conditions that prevailed at the time, do not become the norm.
Not even close but keep looking down like everyone else.  The psychology couldn't me more perfect.  You should look for a time with the entire world, including joe public was this bearish at what they see as a major top instead of this bearish at a major low.  I will save you some time, you will never find one because it doesn't exist and never will.
Risk Disclosure: Trading in financial instruments and/or cryptocurrencies involves high risks including the risk of losing some, or all, of your investment amount, and may not be suitable for all investors. Prices of cryptocurrencies are extremely volatile and may be affected by external factors such as financial, regulatory or political events. Trading on margin increases the financial risks.
Before deciding to trade in financial instrument or cryptocurrencies you should be fully informed of the risks and costs associated with trading the financial markets, carefully consider your investment objectives, level of experience, and risk appetite, and seek professional advice where needed.
Fusion Media would like to remind you that the data contained in this website is not necessarily real-time nor accurate. The data and prices on the website are not necessarily provided by any market or exchange, but may be provided by market makers, and so prices may not be accurate and may differ from the actual price at any given market, meaning prices are indicative and not appropriate for trading purposes. Fusion Media and any provider of the data contained in this website will not accept liability for any loss or damage as a result of your trading, or your reliance on the information contained within this website.
It is prohibited to use, store, reproduce, display, modify, transmit or distribute the data contained in this website without the explicit prior written permission of Fusion Media and/or the data provider. All intellectual property rights are reserved by the providers and/or the exchange providing the data contained in this website.
Fusion Media may be compensated by the advertisers that appear on the website, based on your interaction with the advertisements or advertisers.
© 2007-2024 - Fusion Media Limited. All Rights Reserved.