Stock TA Diverging Hard from Market Price Action
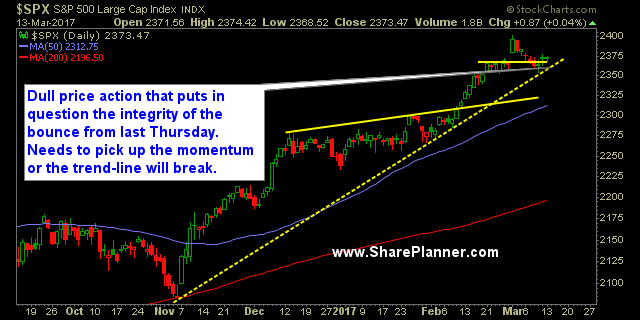
The price action is dull in the overall market, and while the price on the indices still hovers at the all-time highs, the TA of stocks (technical analysis) continues to falter under the surface. Breadth is dismal, and without a catalyst to continue pushing the market higher at this point, profit taking continues to gain momentum under the surface.
There are plenty of stocks whose TA suggests they'll breakout and they aren't hard to find, but the majority of stocks at the moment are languishing. Some are getting hit by downgrades, and others still trying to recover from their earnings reports. And the T2108 is showing that only 2 out of every 5 stocks are trading above their 40-day moving average.
And all of this is masked right now because the Volatility Index (VIX) is getting hammered on a daily basis. I mean, today alone, the index, on the 30 minute chart, only had (2) 30 minute periods where it actually traded higher from open to close. The other 11 periods all traded lower. This kind of behavior is masking the gradual erosion of stock's TA that not many people are talking about at this point.
Just because that is happening though, doesn't mean you get short, because the market isn't giving you a good edge to get short just yet. Heck, this kind of erosion can continue for another few months. Do you really want to keep shorting stocks during a dull market period? Of course not. Wait for the indices to start showing what plenty of stocks are already showing beneath the surface. And be ready for it at any time.
S&P 500 Chart

Current Stock Trading Portfolio Balance:
- 5 long positions
Recent Stock Trade Notables:
- American Airlines Group (NASDAQ:AAL): Short at 44.76, Closed at 44.03 for a 1.6% profit.
- UPRO (Day-Tade): Long at 95.35, closed at 96.50 for a 1.2% profit.
- Bank of the Ozarks (NASDAQ:OZRK): Long at $56.12, closed at $54.69 for a 2.5% loss.
- FNSR: Long at $34.25, closed at 34.70 for a 1.3% profit.
- UPRO (Day-Tade): Long at 96.92, closed at 98.03 for a 1.2% profit.
- JP Morgan Chase (NYSE:JPM): Long at 87.21, closed at 89.67 for a 2.8% profit.
- Chevron (NYSE:CVX): Short at 110.03, covered at 111.85 for a 1.6% loss.
- Flex Ltd (NASDAQ:FLEX): Long at $15.62, closed at $16.57 for a 6.1% profit.
- Baidu Inc (NASDAQ:BIDU): Long at $174.70, closed at $187.00 for a 7.0% profit.
- Ollie's Bargain Outlet: Long at 33.20, closed at $32.50 for a 2.1% loss.
- Corning Incorporated (NYSE:GLW): Long at $26.98, closed at $27.45 for a 1.7% profit.
- Illinois Tool Works (NYSE:ITW): Long at $127.74, closed at $129.86 for a 1.7% profit.
- Marriott Int'l (MAR): Long at $86.16, closed at $87.51 for a 1.6% profit.
