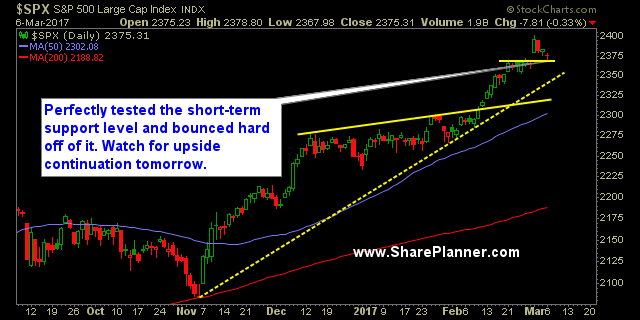
SPX did what it does best following a morning sell-off, and that is, to buy the freakin' dip. ('BTFD' for those looking to add another acronym to their life). Support that I marked in the chart below on yesterday's trading plan identified this as a potential bounce area. I played it likewise by buying UPRO near the lows of the day and closing it with about 10 minutes left in the trading session as a simple day-trade.
But overall, I chose not to buy any additional swing trades until I can see how this market wants to perform tomorrow.
Did you notice the volume on SPDR S&P 500 (NYSE:SPY)? Only 55m shares traded. That is incredibly light and unexciting for us traders. The market traded that way to with very dull price action throughout the duration of the day. Notice too how well the 10-day moving average held up on the charts. Three times in the last seven trading session, price has bounced off of the 10-day moving average like a champ, and right now you could say it is trying to form somewhat of a bull flag pattern.
VIX of course had a nice spike higher to start the day, but it only takes a quick glance at the chart to realize that we are reaching a stage of euphoria that hasn't been seen since in this market since 2007 or before the dot-com bubble ended. I haven't talked much about oil of late, but notice the candle in today's trading session in relation to the rest of the candles on the chart and you'll see how the chart does appear to be rolling over, particularly on the United States Oil Fund (NYSE:USO) chart.
The T2108 continues to drop hard and did so yet again today with an 8.7% decline all the way down to 52%. We are right near all-time highs for the stock market and barely over 50% of the stocks trading over their 40-day moving average. That is an unheard of bearish divergence.
So keep an open mind to what the market may want to do and plan according to the risk parameters that you will want to use going forward.
S&P 500 Chart

Current Stock Trading Portfolio Balance:
- 6 long positions, continuing to tighten the stop-losses on them all.
Recent Stock Trade Notables:
- UPRO (Day-Tade): Long at 96.92, sold clsoed at 98.03 for a 1.2% profit.
- JP Morgan Chase (NYSE:JPM): Long at 87.21, closed at 89.67 for a 2.8% profit.
- Chevron (NYSE:CVX): Short at 110.03, covered at 111.85 for a 1.6% loss.
- Flex Ltd (NASDAQ:FLEX): Long at $15.62, closed at $16.57 for a 6.1% profit.
- Baidu Inc (NASDAQ:BIDU): Long at $174.70, closed at $187.00 for a 7.0% profit.
- Ollies Bargain Outlet Holdings Inc (NASDAQ:OLLI): Long at 33.20, closed at $32.50 for a 2.1% loss.
- Corning Incorporated (NYSE:GLW): Long at $26.98, closed at $27.45 for a 1.7% profit.
- Illinois Tool Works (NYSE:ITW): Long at $127.74, closed at $129.86 for a 1.7% profit.
- Marriott International Inc (NASDAQ:MAR): Long at $86.16, closed at $87.51 for a 1.6% profit.
