My Trading Journal for the Stock Market Today:
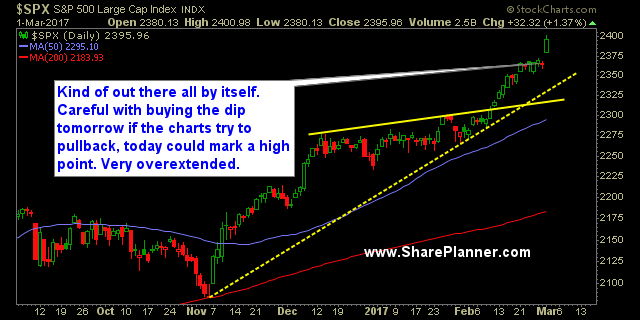
I'm not talking about the speech itself, though I did think the speech was a pretty darn good one, and blew away everyone's expectations. But I am talking about whether the Trump Rally itself can follow through into additional gains tomorrow. History says, "Sure". I mean C'mon, the Dow is up 13 of the last 14 days, and hasn't seen a 1% pullback since October of last year - yeah, seriously, I'm not joking!
Follow through will be impressive tomorrow. If it pulls it off, there is a good chance this rally could continue another couple of weeks before we finally see a significant pullback. Some concerns with today's price action included the fact that the VIX was only down 2.9%. Considering the fact that SPX was up 32 points on the day, I thought we would have seen a drop in the VIX that hovered around 10% or so.
Overall market breadth wasn't so hot either, with only two stocks advancing for every one stock that declined. Finally, oil was a drag on the system as well. The T2108 (% of stocks trading above their 40-day moving average) did fine a 12.6% increase to 64%. Though, when you look at the history of the indicator, considering how bullish the market has been of late, this thing should be hovering around the 85-90% area. This has been a concern for quite some time for me.
Here's the deal. The market keeps going higher. You can think it is absurd, and I personally think it is, but you can't let that affect your decision making. You have to trade based on what the market is showing you, not what you think it should be doing. That is where traders get themselves into trouble. So don't do that to yourself. Trade what you see, manage the risk, and the profits will take care of themselves.
S&P 500 Chart

Current Stock Trading Portfolio Balance:
- 7 long positions, continuing to tighten the stop-losses on them all.
Recent Stock Trade Closeouts:
- JP Morgan Chase (NYSE:JPM): Long at 87.21, closed at 89.67 for a 2.8% profit.
- Chevron (NYSE:CVX): Short at 110.03, covered at 111.85 for a 1.6% loss.
- SPXU: Long at $17.31, closed at $17.22 for a 0.5% loss.
- Flex Technologies (NASDAQ:FLEX) (FLEX): Long at $15.62, closed at $16.57 for a 6.1% profit.
- Broadcom (NASDAQ:AVGO): Long at $208.30, closed at $210.89 for a 1.2% profit.
- Baidu (NASDAQ:BIDU) (BIDU): Long at $174.70, closed at $187.00 for a 7.0% profit.
- Ollie's Bargain Outlet (NASDAQ:OLLI): Long at 33.20, closed at $32.50 for a 2.1% loss.
- SPXU: Long at $17.58, closed at $17.24 for a 1.9% loss.
- Gold Miners ETF (NYSE:GDX): Long at $25.22, closed at $25.04 for a -0.7% loss.
- Corning (NYSE:GLW) (GLW): Long at $26.98, closed at $27.45 for a 1.7% profit.
- Illinois Tool Works (NYSE:ITW): Long at $127.74, closed at $129.86 for a 1.7% profit.
- Marriott International (NASDAQ:MAR) (MAR): Long at $86.16, closed at $87.51 for a 1.6% profit.
- Microsoft (NASDAQ:MSFT): Long at $63.45, closed at $64.09 for a 1% profit.
