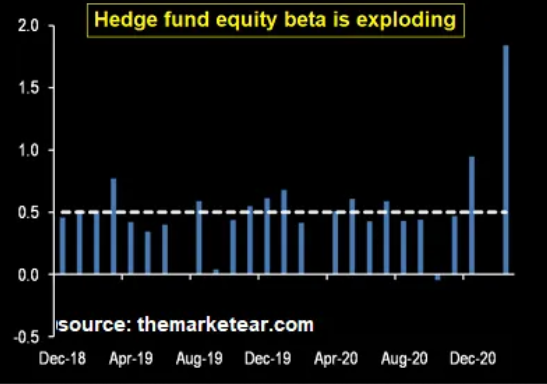
The “beta” for long/short equity hedge funds has more than tripled vs the average beta since at least December 2018. Beta is the most common measure of stock or portfolio volatility relative to a broad equity index. Technically, beta is the percentage change in a stock (or fund) for every one percent change in the index. A stock/fund with a beta of 1 tends to move in percentage correlation with the index. A beta of 2 means a stock/fund moves 2% for a 1% move—up or down—in the index.

As this applies to long/short hedge funds, it means these funds in aggregate have substantially increased their long exposure to the riskiest stocks. For long/short funds, it also likely signals that the net long position is at its highest in a long time and/or the amount of margin/leverage applied is soaring. Hedge funds have been underperforming passive investment funds and the broad indices. My bet is this huge allocation to riskier stocks is a reckless effort to raise hedge fund performance numbers—using other people’s money—and thereby attempt to maximize performance fees charged.
The bottom line is that hedge funds are taking considerably more risk with investor money (think: pensions) than historically. When the market eventually craps out, this will not end well, especially for pension funds, which themselves have increased their equity allocation, on average across public pensions, to 80% vs 40-50% historically. I would also suggest that this another indicator that a market top draws closer.
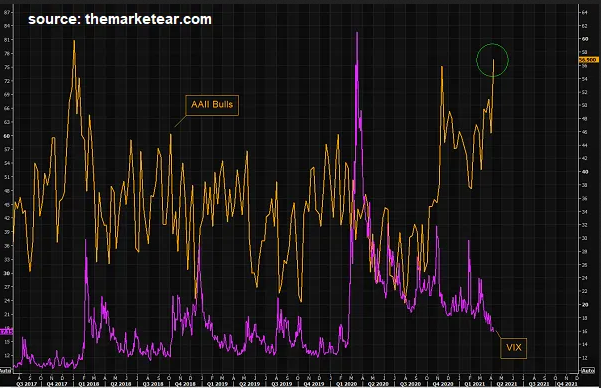
The fear of missing out on the “next” market melt-up is huge right now:

The American Association of Individual Investors (AAII) sentiment index hit a three-year high for the for weekly period ending Apr. 7, with nearly 57% of the respondents expecting the stock market to be higher in the next six months. The last time this index was higher than it is now was January 2018, right before the SPX dropped 10% in nine trading days. Furthermore, the AAII bearish sentiment reading has hit a post-virus crisis low, with just 20.4% of the survey respondents feeling bearish. This is lower than the reading in late 2019, which preceded the market crash that started in February 2020.
The surge in risk-taking and individual investor euphoria drove both the Dow and the SPX to new highs this past week. The NASDAQ launched off its 100 dma and was up 3.1%, though it is still below its ATH on Feb. 12. The Russell 2000 declined marginally on the week. It’s notable that volume declined every day this past week and, on average, was at its lowest since mid-February. Call option volume also continued to decline.
Data for the latest week shows the insider sell/buy ratio jumped more than 100% from the prior week to 45x from 21x. This means that insiders sold 45x more shares than they purchased. Keep in mind “purchase” often refers to stock received by exercising low-dollar or zero-cost stock options which is then sold.
Bloomberg featured a report on Thursday that a “whale” account made a huge bet on a big move in the VIX, which closed at $16.69 on Friday. The account bought 300,000 July VIX 25 call options and sold 300,000 July VIX 40 calls. This is a bet that the VIX will close between 25 and 40 by mid-July. A sophisticated speculator is speculating on a big sell-off in stocks sometime between now and July.
Despite running up 13 days in a row, the S&P 500 is historically overvalued. The technicals, like the RSI, are flashing “overbought.” While public officials like Jay Powell and Janet Yellen deny the the idea that stocks are in a bubble (see former Fed Head, Ben Bernanke, comment in late 2007 that subprime mortgages were contained for credibility of Fed official assertions), the metrics combined with the fundamentals suggest the stock market is poised for a very painful drawdown.
At some point the Fed’s money printing will diminish the value of the US dollar at to the point at which the law of diminish returns (from money printing) forces impotency on official market intervention. Historical experience in on the side of this viewpoint.
