
**NEW** As part of the ongoing process to offer new and up-to-date information regarding seasonal and technical investing, we are adding a section to the daily reports that details the stocks that are entering their period of seasonal strength, based on average historical start dates. Stocks highlighted are for information purposes only and should not be considered as advice to purchase or to sell mentioned securities. As always, the use of technical and fundamental analysis is encouraged in order to fine tune entry and exit points to average seasonal trends.
Stocks Entering Period of Seasonal Strength Today:
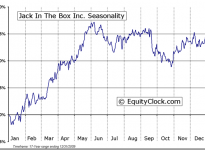
Jack in the Box Inc. (NASDAQ:JACK) Seasonal Chart
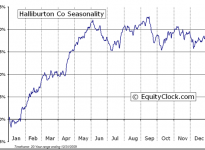
Halliburton Company (NYSE:HAL) Seasonal Chart
The Markets
Stocks plunged on Monday as the price of oil took another leg lower, weighing once again on the energy sector. The price of Oil is now down by almost 54% since hitting its 2014 high of $107.68, a free-fall that is becoming reminiscent of the 2009 swoon. The 2009 low is the next significant point of reference, providing the best opportunity for a rebound attempt. Prior to the strong rise in the commodity from 2004 through to 2008, multi-year resistance was evident around $40. That previous level of resistance turned into support during the 2008-2009 collapse. This level is expected to act as support once again.As prices nears $40, negative bets on the commodity are likely to be shed and speculators will become willing to enter, providing momentum for a long-overdue bounce. Recall that the period of seasonal strength for the commodity is around the corner, gaining, on average, from the end of February through to May as supply and demand imbalances shift in favour of higher prices through the spring. The upcoming trade in Oil and the energy sector continues to hold appeal, assuming support is maintained over the weeks ahead.

 Seasonal Chart")
The longer-term prospect for the commodity market, however, remains questionable. The US Dollar Index continues to climb following the bottoming pattern charted over the last many years. With the breakout in the currency benchmark above resistance at 89, confirmation of a positive long-term trend has been provided, the impact of which is certain to weigh on commodities priced in the domestic currency. During the late 90’s, the last time the US Dollar realized a sustained multi-year rise, commodities were the weakest performing asset class, weighing upon stocks in the materials sector. A trend of underperforming returns amongst material stocks is already evident; losses on an absolute basis may now be following. Seasonally, the US Dollar Index tends to rise through the first two months of the new year, a threat to material stocks over the short-term.

 Seasonal Chart")

Sentiment on Monday, as gauged by the put-call ratio, ended bearish at 1.23.

Seasonal charts of companies reporting earnings today:


TSE Composite


Horizons Seasonal Rotation ETF (TO:HAC)
- Closing Market Value: $14.89 (down 1.97%)
- Closing NAV/Unit: $14.93 (down 1.77%)
Performance*
| 2015 Year-to-Date | Since Inception (Nov 19, 2009) | |
| HAC.TO | -1.32% | 49.3% |
* performance calculated on Closing NAV/Unit as provided by custodian
