
**NEW** As part of the ongoing process to offer new and up-to-date information regarding seasonal and technical investing, we are adding a section to the daily reports that details the stocks that are entering their period of seasonal strength, based on average historical start dates. Stocks highlighted are for information purposes only and should not be considered as advice to purchase or to sell mentioned securities. As always, the use of technical and fundamental analysis is encouraged in order to fine tune entry and exit points to average seasonal trends.
Stocks Entering Period of Seasonal Strength Today:
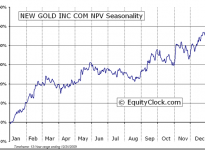
New Gold Inc. (AMEX:NGD) Seasonal Chart
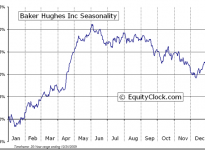
Baker Hughes Incorporated (NYSE:BHI) Seasonal Chart
The Markets
Stocks plunged on Monday, dragged lower by a panic selloff in the energy sector as the price of oil charted new multi-year lows. The Energy sector ETF (SPDR Energy Select Sector Fund (ARCA:XLE)) shed 4.05%, breaking below the lows set back in October. The intermediate-term trend of the sector remains negative, as suggested by the direction of the 50-day moving average. Next zone of significant support is apparent between $73 and $76, essentially forming the range from which the sector ETF broke out from in 2013; longer term implications for the sector may hinge on whether or not this range of support holds. The weakness in the sector is not all that surprising at this time of year. Recall that the period of seasonal weakness attributed to tax-loss selling runs between December 5th and December 15th, on average. With Energy stocks firmly in the red for the year, the sector was the most vulnerable for declines in this end of year portfolio reallocation period. The sector is also at the time of year when the period of seasonal weakness peaks, on average. Energy is the weakest sector of the market between September 15th and December 7th, on average; the sector subsequently picks up momentum into the end of the year as investors accumulate the depressed shares. With all of this in mind, weakness over the days ahead may provide an ideal buying opportunity for a rebound bounce into year end, particularly if the range of support mentioned remains unbroken. The sector has averaged a gain 1.43% between December 18th and December 31st, outperforming the market over the short period. The sector enters a period of seasonal strength in mid to late January, running through to May.


The weakness in the Energy sector had a significant impact on the Canadian equity market, which saw the TSX Composite decline by over 3% at the session low; the benchmark subsequently rebounded into the close, ending lower by 2.28%, enough for the worst one-day decline since June of 2013. The bearish head-and-shoulders setup, identified in a previous report, remains in play; downside target of the negative pattern points to the October low around 13,700. Similar to the energy sector, the TSX Composite seasonally rebounds into the end of the year, outperforming US counterparts as the benchmark enters its period of seasonal strength that runs between December 18th and March 7th, on average. The benchmark has yet to chart a bottoming pattern following a break of the longer-term trend in September. Support below the October low can be derived at 12,900, the level from which the benchmark broke out of in October of 2013. Look for possible buying opportunities in the Canadian benchmark once tax loss selling pressures fade into the latter half of the month.


On a day when losses seemed more widespread than gains, the number of NYSE listed stocks that charted new 52-week highs jumped over 65%, compared to the session prior. Of course, the number of stocks that charted new 52-week lows was also elevated, surging over 120% compared to the previous day. Not only do these diverging statistics suggest indecision, they suggest rotation as investors shift from one area of the market to another as investors seek to rebalance portfolios into the end of the year. Health Care and Financials are two sectors that are seeing inflows as energy stocks are liquidated. Both the Health Care and Financial sectors remain seasonally strong into the new year.


Sentiment on Monday, as gauged by the put-call ratio, ended bearish at 1.04.

Seasonal charts of companies reporting earnings today:


S&P 500 Index


TSE Composite


Horizons Seasonal Rotation ETF (TO:HAC)
- Closing Market Value: $14.86 (down 1.07%)
- Closing NAV/Unit: $14.91 (down 0.88%)
Performance*
| 2014 Year-to-Date | Since Inception (Nov 19, 2009) | |
| HAC.TO | 4.27% | 49.1% |
* performance calculated on Closing NAV/Unit as provided by custodian
