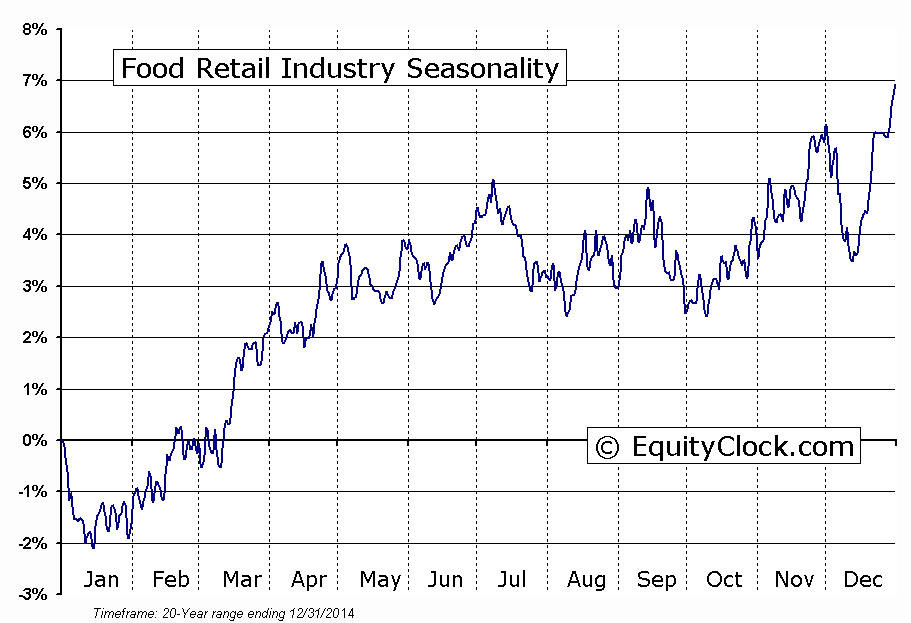
Stocks Entering Period of Seasonal Strength Yesterday:
Yamana Gold (TO:YRI)
The Markets
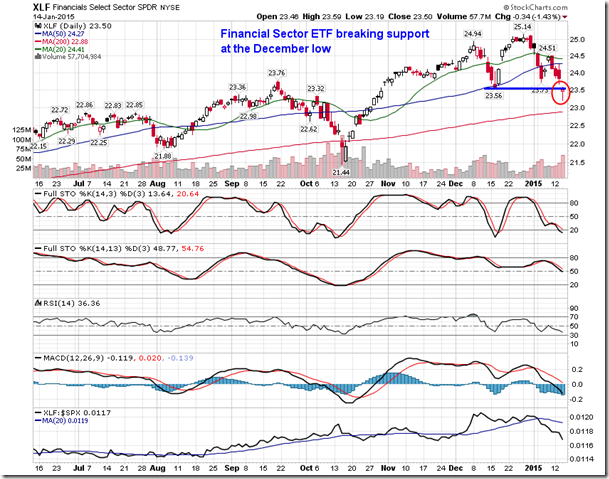
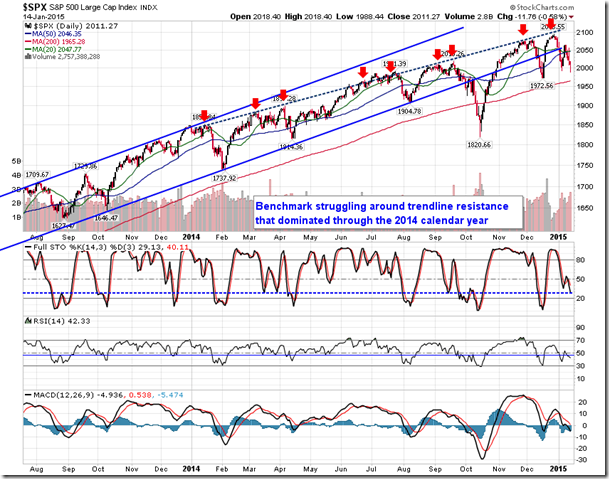
Stocks struggled on Wednesday, pulled lower by a cut in the global growth forecast from the World Bank and disappointing bank earnings from JP Morgan and Wells Fargo. The financial sector posted a loss of 1.43%, leading the market to the downside. The sector has been significantly underperforming the market since the year began as record low rates and concerns pertaining to the sector’s exposure to loans for energy companies has kept investors away from stocks in this space, despite mildly positive seasonal tendencies for this time of year.
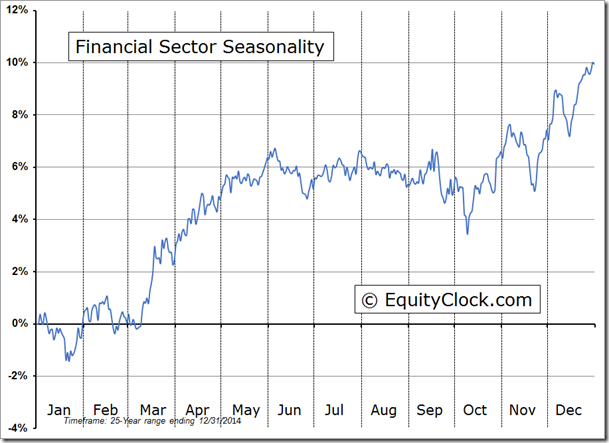
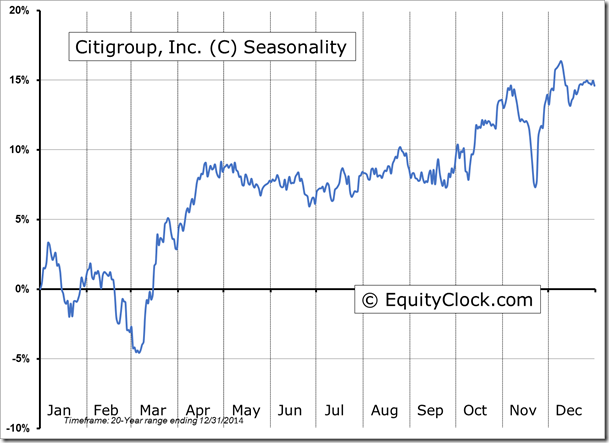
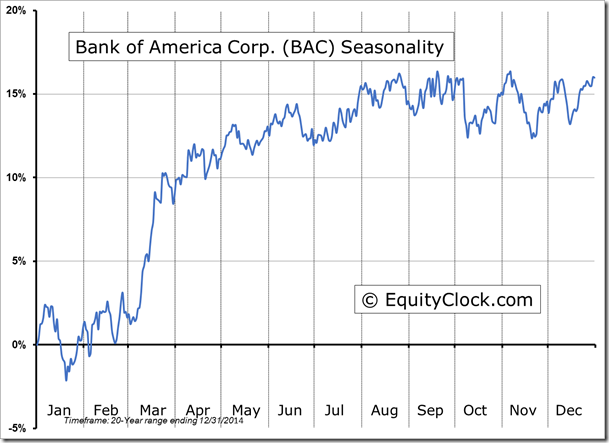
With Wednesday’s move lower, the financial sector ETF XLF) broke below short-term support at $23.56, suggesting downside implications to $22.50. The ETF has traded predominantly above its 200-day moving average for the past year and a half, keeping the longer-term positive trend intact. Weakness over the near-term may present ideal buying opportunities for the spring period of seasonal strength when the sector averages gains of around 2.3% in both March and April. Investors will have another opportunity to react to earnings from companies in the sector when Bank of America and Citigroup report on today.
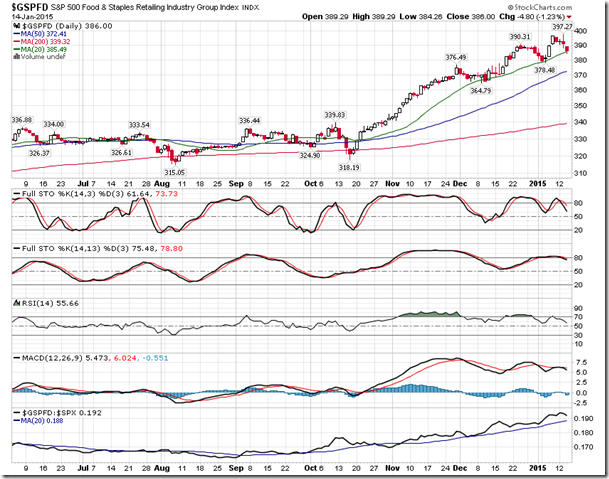
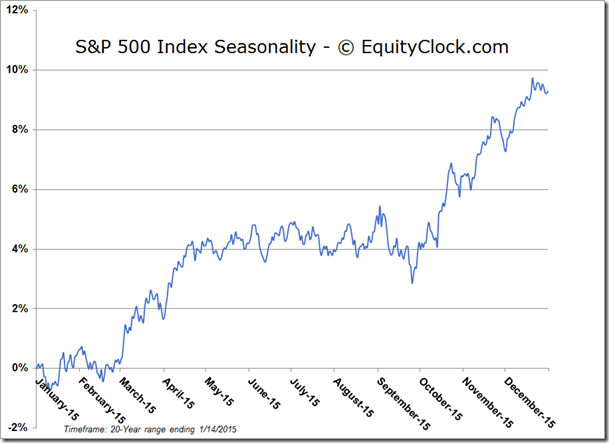
Looking at the sector activity, risk aversion is becoming increasingly apparent. Defensive equity sectors have been outperforming the market since the year began as investors rotate into lower beta stocks with less exposure to the global economy and/or falling commodity prices. This defensive stance is similar to last year when investors rotated into stocks in the Utilities and Health Care sectors, leaving the broader equity market to falter in the first month of the year. Typically, defensive sectors, mainly Utilities and Consumer Staples, are the worst performers in the month of January, suffering from the so-called “January Effect” as investors take on more risk to start the new year. When investors shy away from risk to start the year, concerns are raised pertaining to the strength of the market for the entire calendar year.
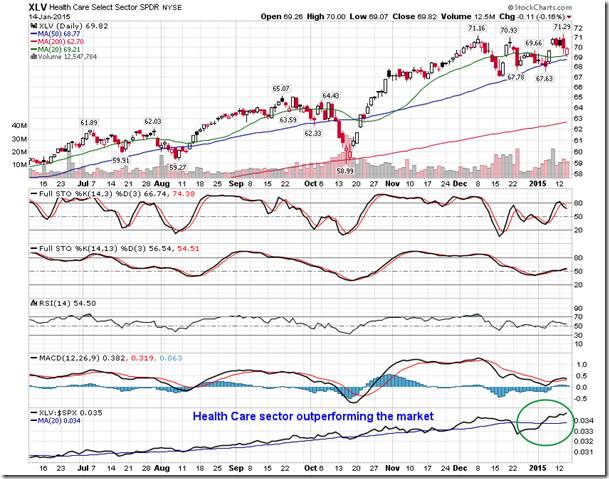
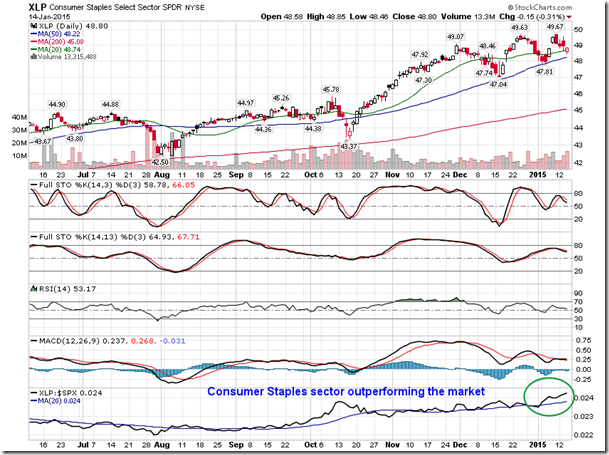
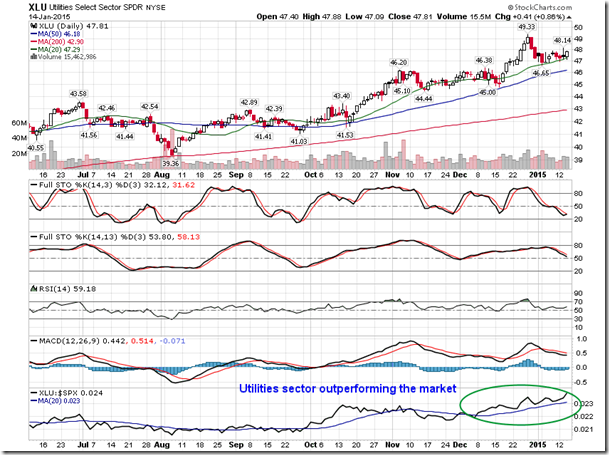
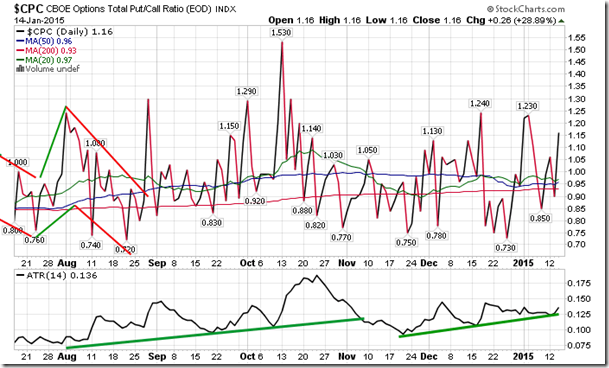
Sentiment on Wednesday, as gauged by the put-call ratio, ended bearish at 1.16.
Sectors and Industries entering their period of seasonal strength:

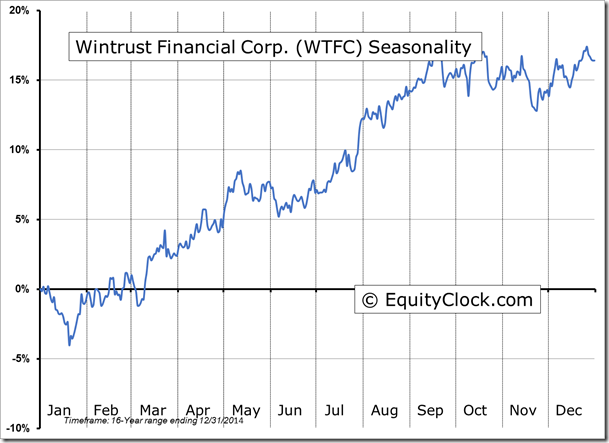
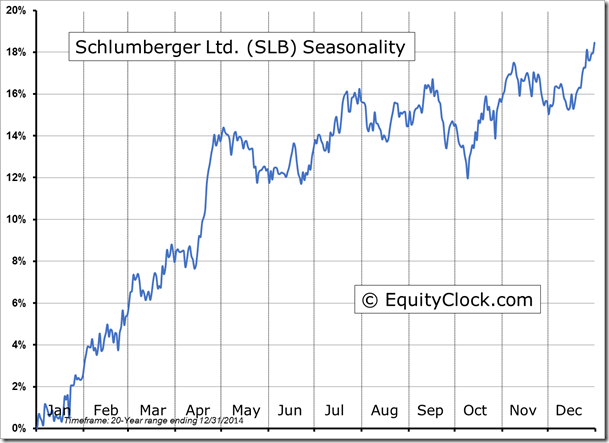
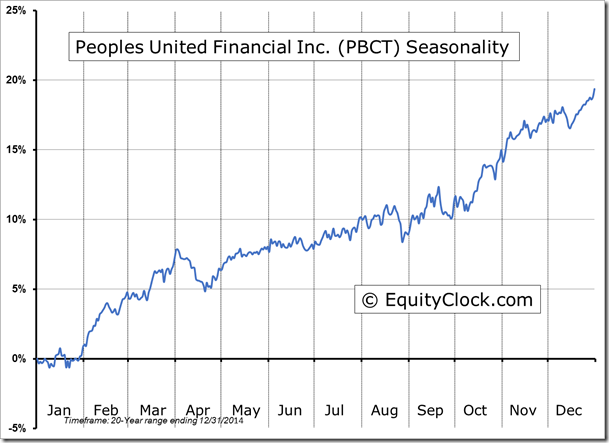
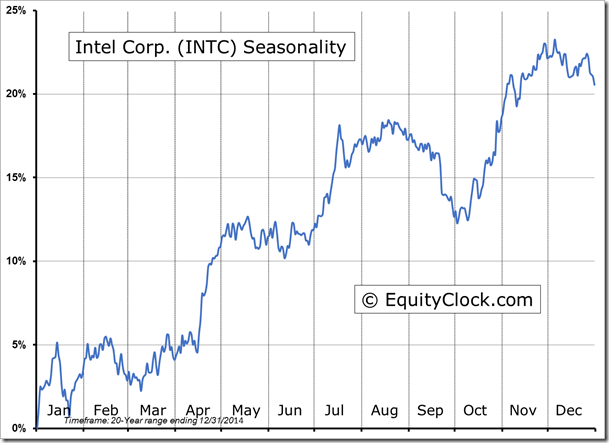
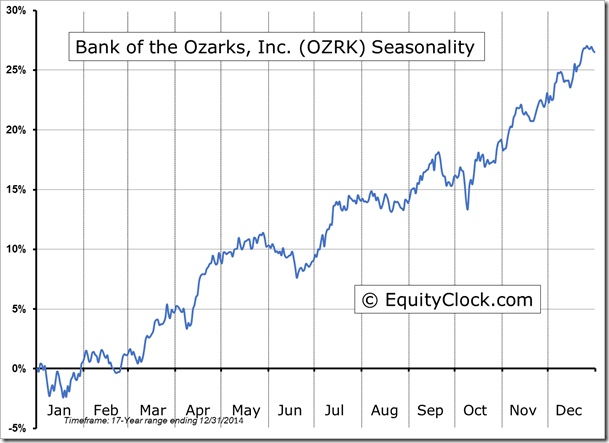
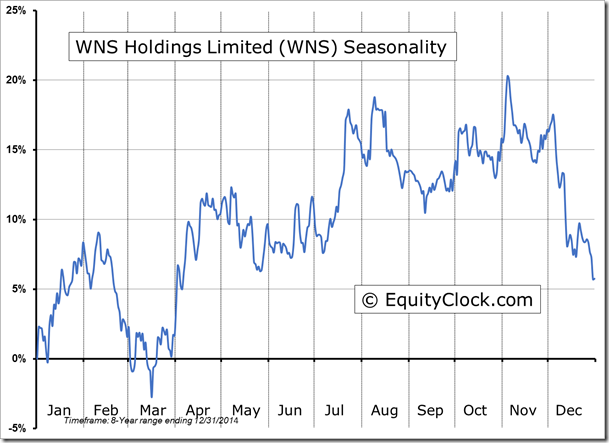
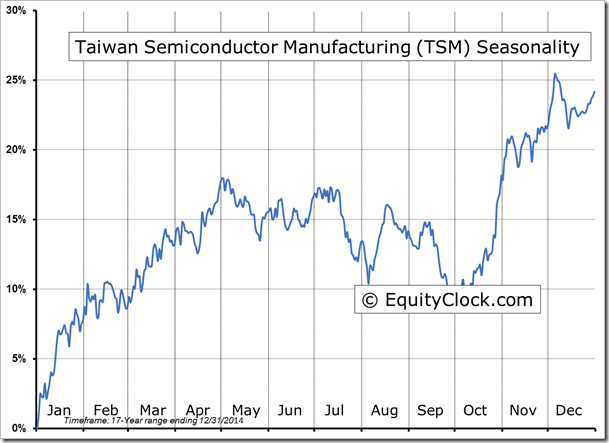
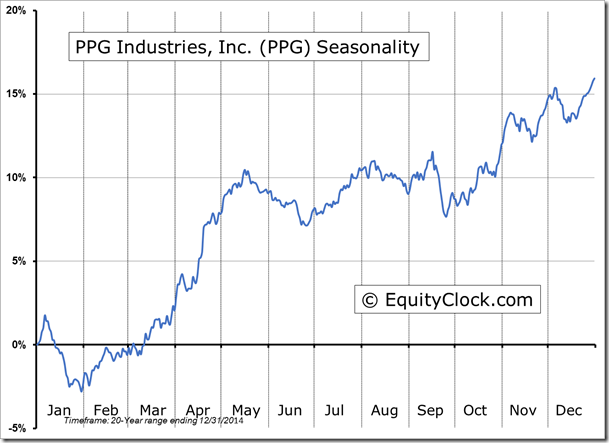
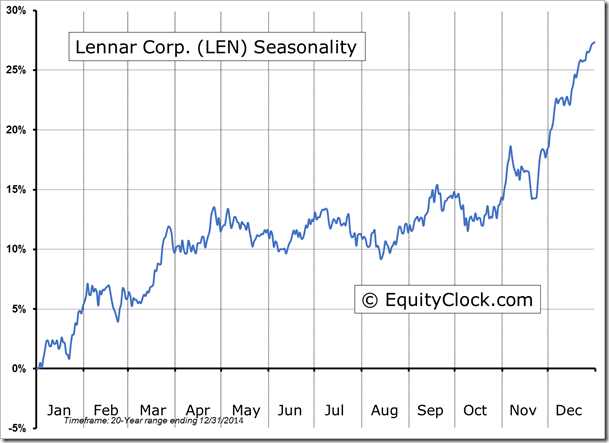
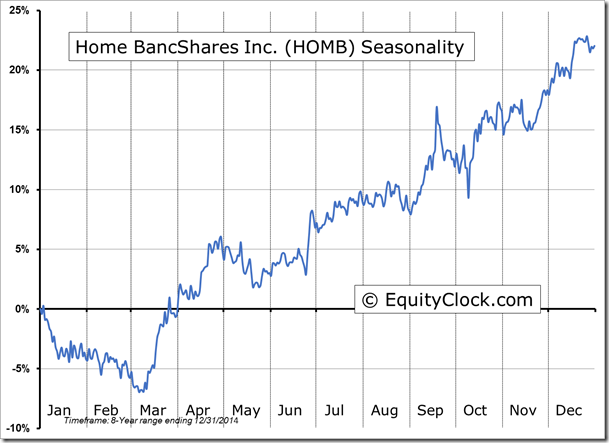
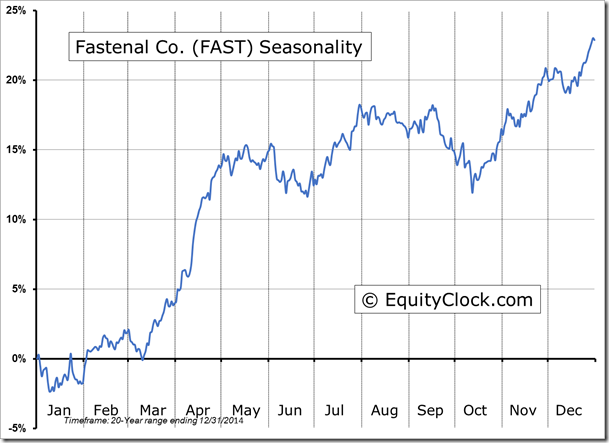
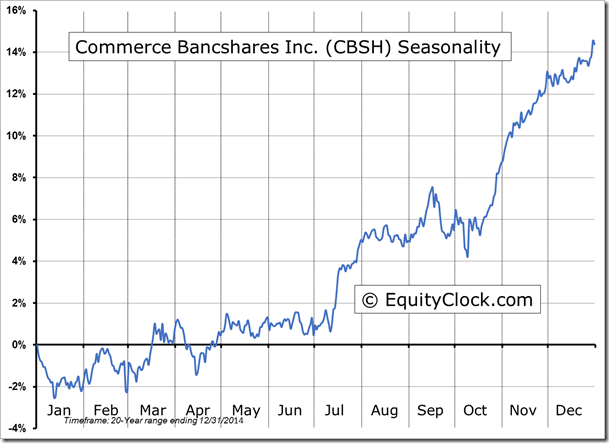
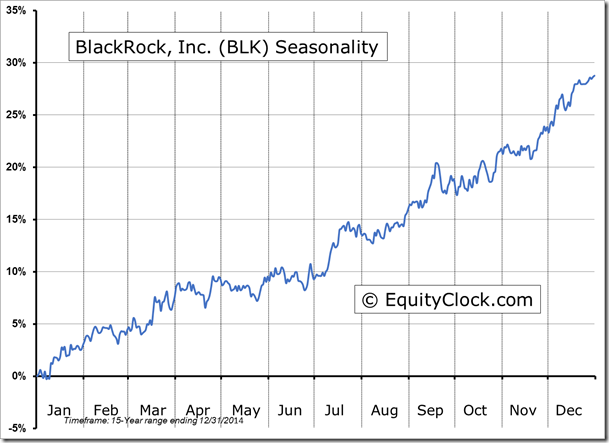
Seasonal charts of companies reporting earnings yesterday:
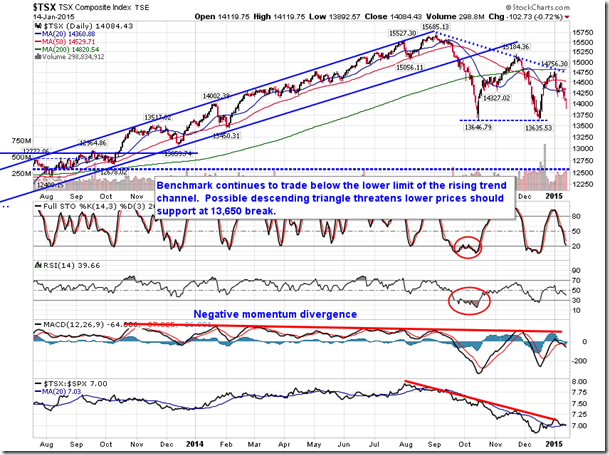
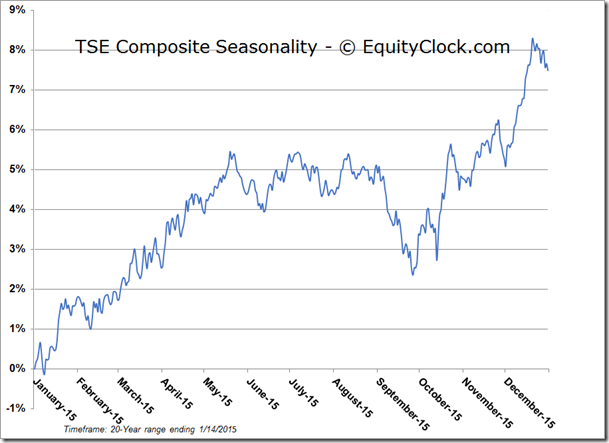
TSE Composite
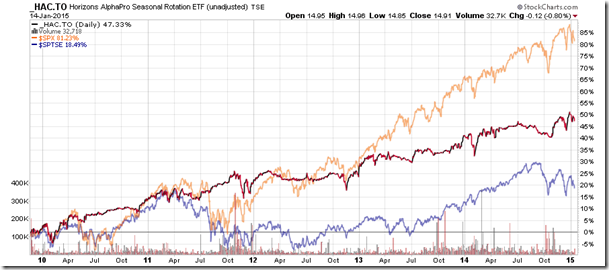
Horizons Seasonal Rotation ETF (TO:HAC)
- Closing Market Value: $14.91 (down 0.80%)
- Closing NAV/Unit: $14.95 (down 0.83%)
Performance
| 2015 Year-to-Date | Since Inception (Nov 19, 2009) | |
| HAC.TO | -1.19% | 49.5% |
* performance calculated on Closing NAV/Unit as provided by custodian
Disclaimer: Stocks highlighted are for information purposes only and should not be considered as advice to purchase or to sell mentioned securities. As always, the use of technical and fundamental analysis is encouraged in order to fine tune entry and exit points to average seasonal trends.

