Stocks Entering Period of Seasonal Strength Today:
Arch Coal, Inc. (NYSE:ACI) Seasonal Chart
Imperial Oil Limited (TSE:IMO) Seasonal Chart
PPG Industries, Inc. (NYSE:PPG) Seasonal Chart
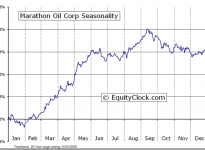
Marathon Oil Corporation (NYSE:MRO) Seasonal Chart
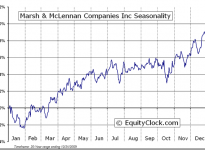
Marsh & McLennan Companies, Inc. (NYSE:MMC) Seasonal Chart
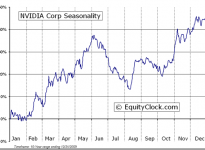
NVIDIA Corporation (NASDAQ:NVDA) Seasonal Chart
The Markets
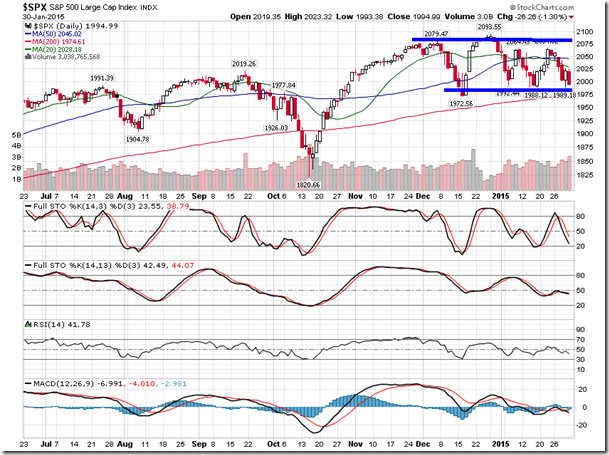
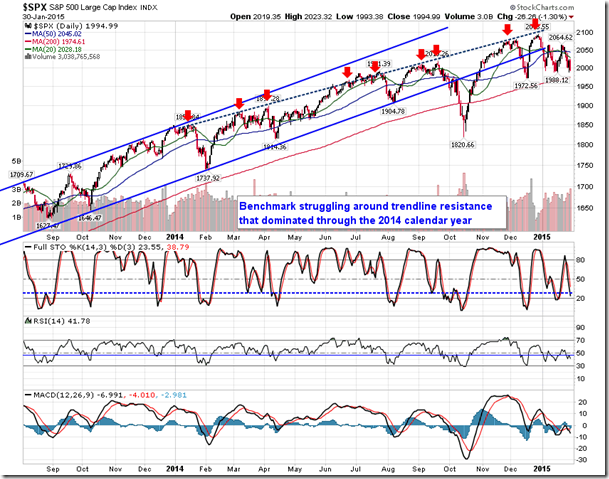
Stocks ended lower on Friday following a disappointing report on GDP for the fourth quarter. The S&P 500 Index closed down by 1.30%, once again testing short-term support around 1988.
Friday’s session also concluded the first month of 2015, the result of which has caused investors to be concerned of the potential returns for the year ahead.Investors are now looking toward the January Barometer to anticipate the performance for the remainder of the year.The theory behind the barometer is that the direction of the equity market during the month of January will forecast the movement of the market through the remainder of the year.
The January decline of 3.10% on the S&P 500 Index suggests further losses to follow. However, history suggests that using January as an indicator as to how the rest of the year will perform may be flawed. Of the 24 losing Januarys over the past 60 years, only 10 (42%) have seen losses continue through the remaining 11 months.The “predictive power” of the barometer during negative Januarys, such as the one that just past, is clearly weak. Overall, the barometer has shown a success rate of 68% when the positive and negative Januarys are combined due to the 86% success rate of positive Januarys following by positive returns through the remainder of the year.
Given that the general propensity for the broad market is for gains over the long-term, the higher frequency of success for positive years is to be expected. Since the new year is only one month old and major benchmarks have yet to break support, it remains too early to speculate on the direction of equity markets through the remaining months of the year.
| S&P 500 Index returns following negative Januarys | ||
| Year | January Return | Remaining 11 Months |
| 2014 | -3.56% | 15.50% |
| 2010 | -3.70% | 17.11% |
| 2009 | -8.57% | 35.02% |
| 2008 | -6.12% | -34.48% |
| 2005 | -2.53% | 5.67% |
| 2003 | -2.74% | 29.94% |
| 2002 | -1.56% | -22.15% |
| 2000 | -5.09% | -5.32% |
| 1992 | -1.99% | 6.59% |
| 1990 | -6.88% | 0.35% |
| 1984 | -0.92% | 2.34% |
| 1982 | -1.75% | 16.81% |
| 1981 | -4.57% | -5.40% |
| 1978 | -6.15% | 7.69% |
| 1977 | -5.05% | -6.79% |
| 1974 | -1.00% | -29.00% |
| 1973 | -1.71% | -15.93% |
| 1970 | -7.65% | 8.39% |
| 1969 | -0.82% | -10.63% |
| 1968 | -4.38% | 12.60% |
| 1962 | -3.79% | -8.34% |
| 1960 | -7.15% | 4.50% |
| 1957 | -4.18% | -10.58% |
| 1956 | -3.65% | 6.50% |
| Average: | -3.98% | 0.85% |
| Loss Frequency: | 100% | 42% |
| S&P 500 Index returns following positive Januarys | ||
| Year | January Return | Remaining 11 Months |
| 2013 | 5.04% | 23.38% |
| 2012 | 4.36% | 8.67% |
| 2011 | 2.26% | -2.22% |
| 2007 | 1.41% | 2.09% |
| 2006 | 2.55% | 10.80% |
| 2004 | 1.73% | 7.14% |
| 2001 | 3.46% | -15.95% |
| 1999 | 4.10% | 14.82% |
| 1998 | 1.02% | 25.40% |
| 1997 | 6.13% | 23.44% |
| 1996 | 3.26% | 16.46% |
| 1995 | 2.43% | 30.93% |
| 1994 | 3.25% | -4.64% |
| 1993 | 0.70% | 6.31% |
| 1991 | 4.15% | 21.27% |
| 1989 | 7.11% | 18.80% |
| 1988 | 4.04% | 8.03% |
| 1987 | 13.18% | -9.85% |
| 1986 | 0.24% | 14.35% |
| 1985 | 7.41% | 17.62% |
| 1983 | 3.31% | 13.51% |
| 1980 | 5.76% | 18.92% |
| 1979 | 3.97% | 8.02% |
| 1976 | 11.83% | 6.54% |
| 1975 | 12.28% | 17.16% |
| 1972 | 1.81% | 13.58% |
| 1971 | 4.05% | 6.48% |
| 1967 | 7.82% | 11.38% |
| 1966 | 0.49% | -13.51% |
| 1965 | 3.32% | 5.56% |
| 1964 | 2.69% | 10.01% |
| 1963 | 4.91% | 13.32% |
| 1961 | 6.32% | 15.81% |
| 1959 | 0.43% | 8.01% |
| 1958 | 4.28% | 32.40% |
| 1955 | 1.81% | 24.16% |
| Average: | 4.25% | 11.34% |
| Gain Frequency: | 100.00% | 86.11% |
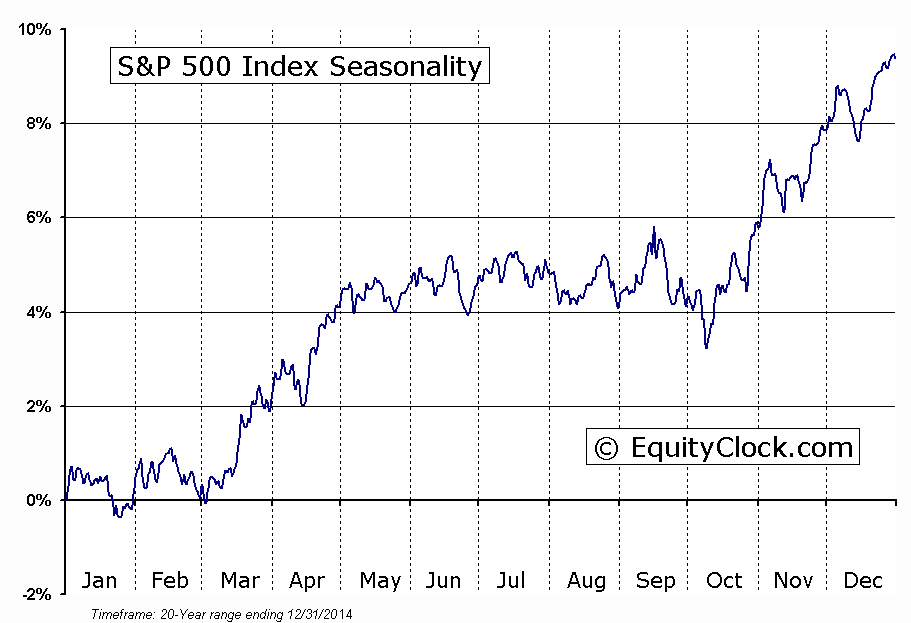
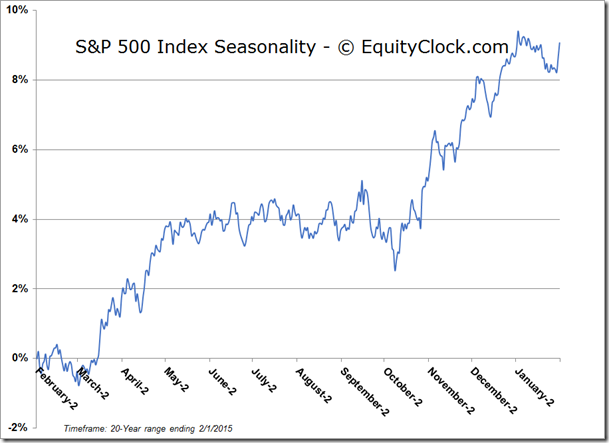
Looking forward to the month of February, volatility remains the norm as earnings season continues. Over the last 20 years, the S&P 500 has averaged a decline of 0.3%, however, positive results have been recorded in 60% of Februarys. Following fourth quarter economic strength, the first two months of the year tend to have few catalysts to influence stocks in any particular direction, causing equity market gyrations during the earnings reporting period. Profit-taking following fourth quarter earning results is also a factor behind the volatile trading activity. Stocks resume their gaining path into the month of March as the economy rebounds following the winter months. Over the last 20 years, consumer and material stocks have been the best performers in the month of February, gaining in 65% of periods and averaging returns around 1%; Financials, Technology, and Utilities have been the weakest sectors in February, each gaining in 55% of periods and averaging a loss of around 1.3%. Currently, the weakest sectors during the month represent almost 40% of the weight of the S&P 500 Index, suggesting that the best performing sectors have to post strong returns in order to lift broad equity benchmarks higher.

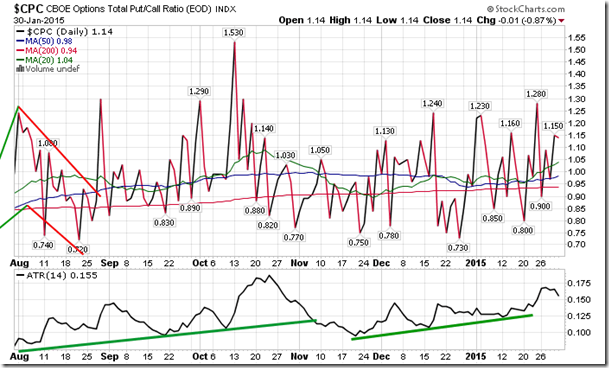
Sentiment on Friday, as gauged by the put-call ratio, ended bearish at 1.14.
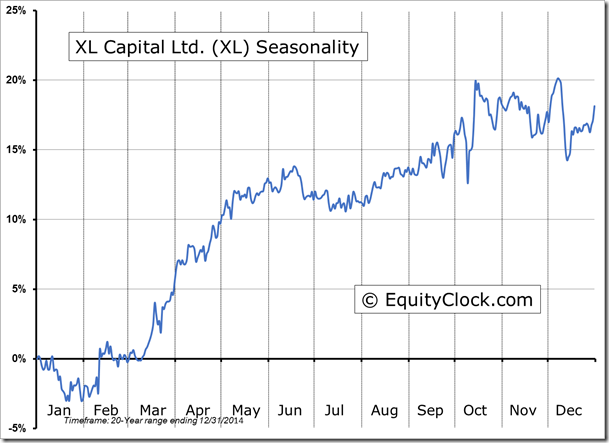
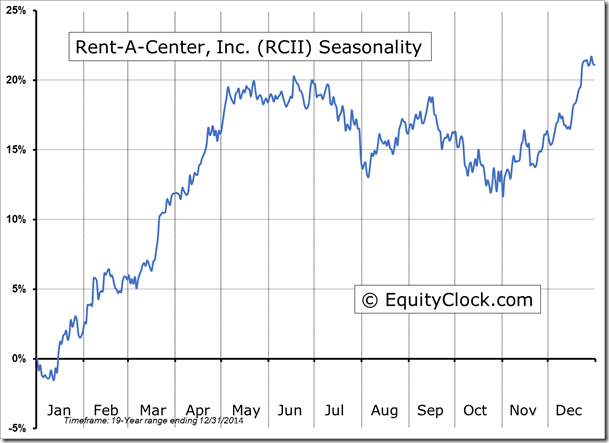
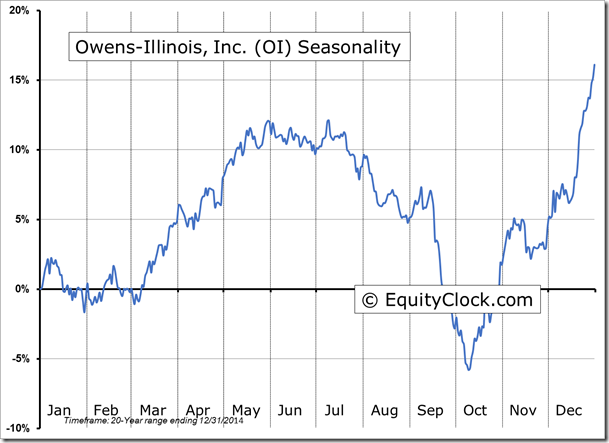
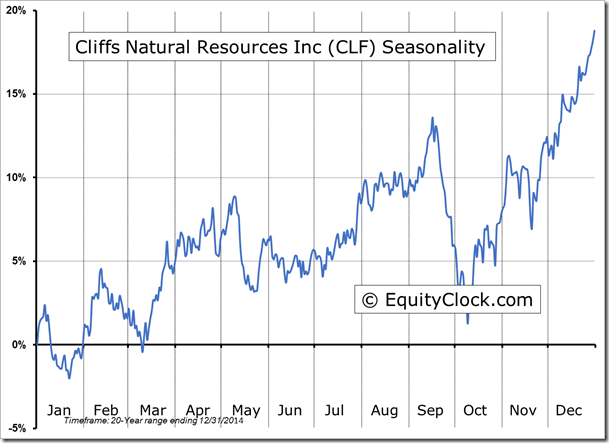
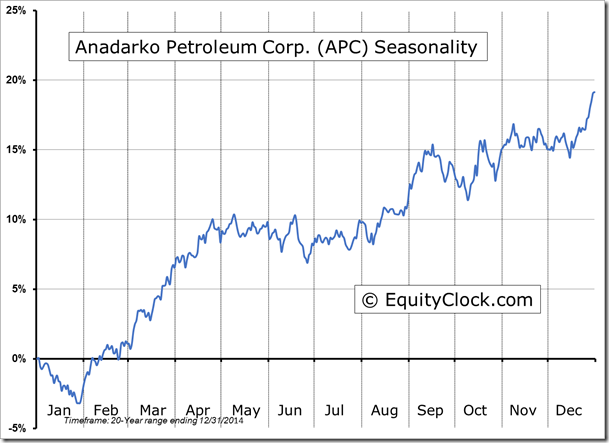
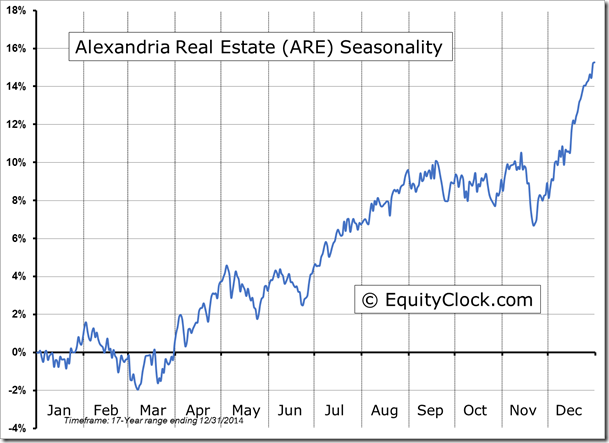
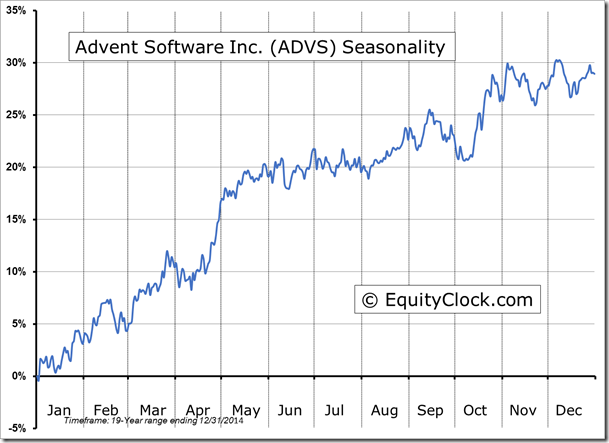
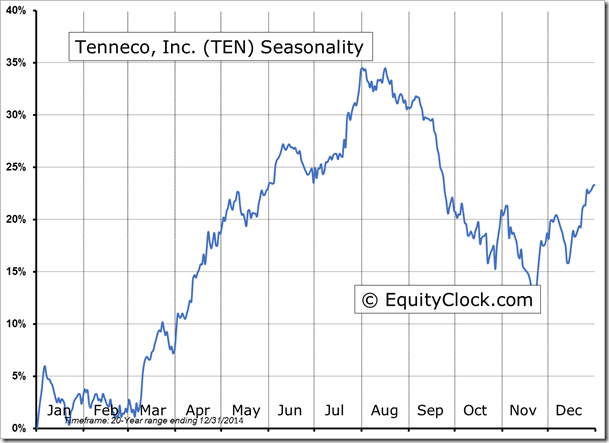
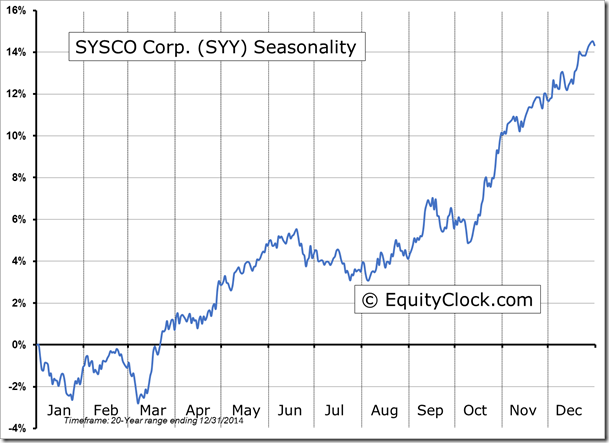
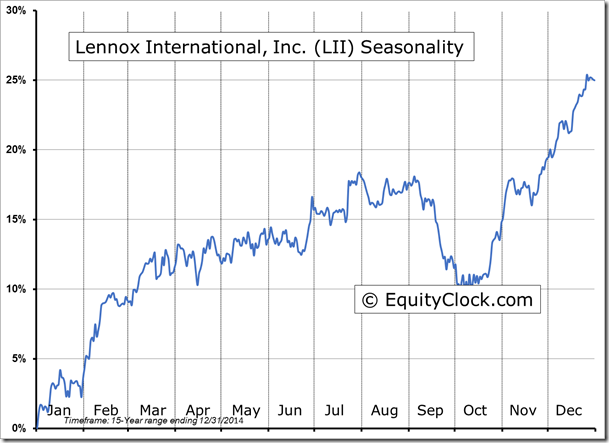
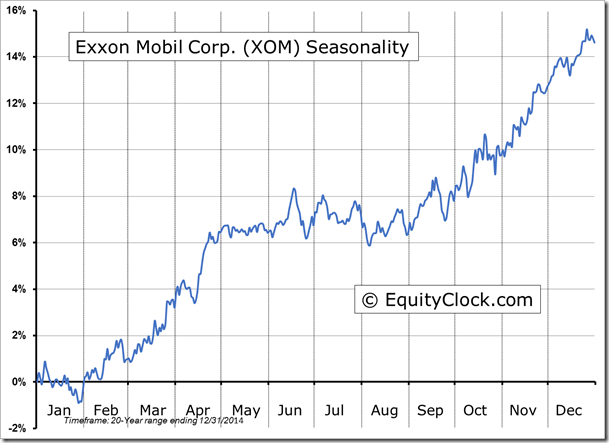
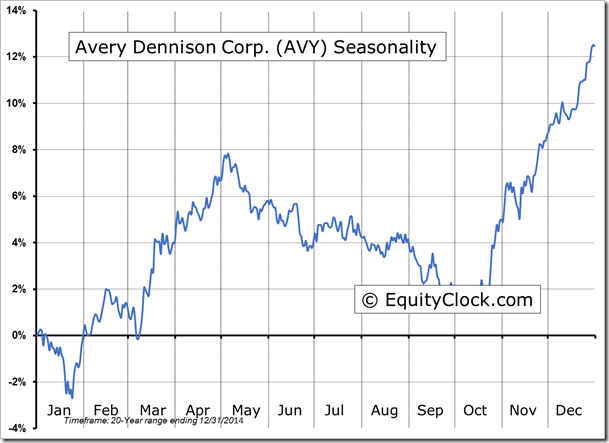
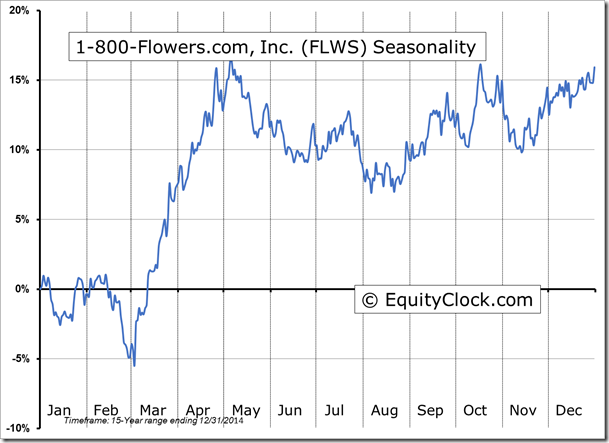
Seasonal charts of companies reporting earnings today:
S&P 500 Index
TSE Composite
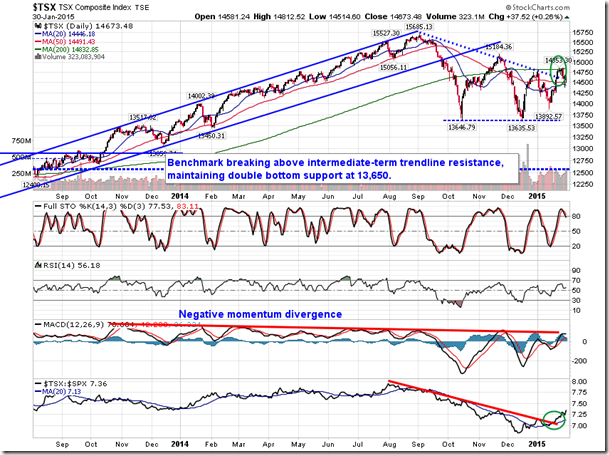
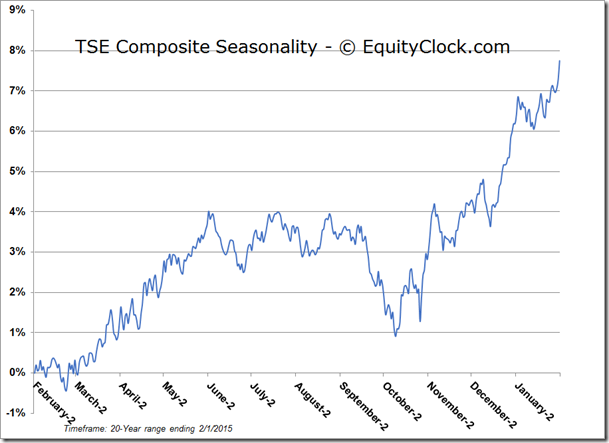
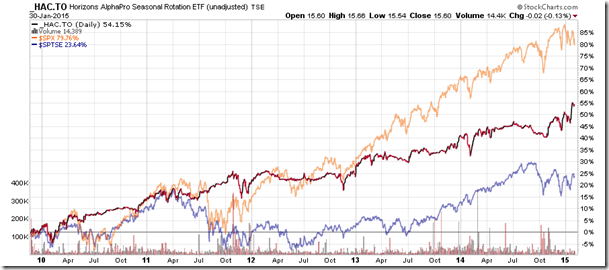
Horizons Seasonal Rotation ETF (TO:HAC)
- Closing Market Value: $15.60 (down 0.13%)
- Closing NAV/Unit: $15.56 (down 0.34%)
Performance*
| 2015 Year-to-Date | Since Inception (Nov 19, 2009) | |
| HAC.TO | 2.84% | 55.6% |
* performance calculated on Closing NAV/Unit as provided by custodian
Disclaimer: Stocks highlighted are for information purposes only and should not be considered as advice to purchase or to sell mentioned securities. As always, the use of technical and fundamental analysis is encouraged in order to fine tune entry and exit points to average seasonal trends.

