
We’re increasingly bombarded with market information, but if the information is geared towards a time horizon different than your trading thesis, it can be irrelevant, or worse–a source for error.
The Stock Exchange is all about trading. Each week we do the following:
- discuss an important issue for traders;
- highlight several technical trading methods, including current ideas;
- feature advice from top traders and writers; and
- provide a few (minority) reactions from fundamental analysts.
We also have some fun. We welcome comments, links, and ideas to help us improve this resource for traders. If you have some ideas, please join in!
Review: Is It Time to Lever Up on Momentum?
Our previous Stock Exchange asked the question: Is It Time To Lever Up On Market Momentum? We noted the market has been very strong this year, but asked if now is the time to get aggressive with your trades? And despite some concerns over a yield curve that has recently flashed inversion, there are reasons to believe this current bull market rally can go higher still.
This Week: What Is Your Trading Timeframe Now?
Perhaps your trading timeframe is based on your personal strategy and goals, and it almost never changes. Or perhaps it changes often based on current market conditions. Regardless, one of the biggest sources of trading errors, risks and confusion is based on understanding and communicating your trading timeframe. Even though there seems to be an ever growing supply of investment and trading information, who is it targeted towards? Specifically, what trading timeframe?
Trading Psychologist, Dr. Brett Steenbarger, does an excellent job summarizing this dilemma in his recent post titled “A Formula for Trading and Investing Disaster,” as follows:
Many problems of trading and investing have a simple source: People follow the markets on a different time scale from their intended holding period. Typically this means becoming psychologically attached to shorter-term movements up and down and not holding positions as initially intended. The general rule is that, as pattern-recognizing beings, we will find patterns in whatever time frame we follow. When our egos become attached to the patterns we perceive, we act on what we see at the moment and fail to maximize our trades and investments.
And sticking with the topic of “disasters” for a moment, Logan Kane asks “Is Your Portfolio a Timebomb?” where he insightfully explains:
Most [portfolio] meltdowns come from some combination of leverage, concentration of risk, and illiquidity.
And if you get the time horizon wrong, the meltdown sources can be even more painful.
Importantly, different timeframes often make for a sharp contrast between investors and traders, with the former often focused on longer-term horizons, and the latter focused on shorter-term horizons.
Our own trading models, which we will review later in this report, have varying timeframes for their trades, ranging from a few weeks up to approximately 12-months or more. We’ll review examples of their recent trading activity later in this report, whereby we’ll highlight the different types of information that can be important to shorter-term traders, but practically irrelevant to long-term investors, and vice versa.
Model Performance:
Our trading programs were nudging us to move to almost entirely cash last December–which worked out well in terms of actual client account performance. However, the models and trading programs have moved back to normal trading and cash levels, and they’ve been performing well recently, thereby magnifying our stronger performance relative to the weaker performance when the programs held higher cash balances. And we are sharing the performance of our proprietary trading models, as our readers have requested.

Controlling Risk:
We find that blending a trend-following / momentum model (Athena) with a mean reversion / dip-buying model (Holmes) provides two strategies, effective in their own right, that are not correlated with each other or with the overall market. By combining the two, we can get more diversity, lower risk, and a smoother string of returns.
And since many clients combine the trading models with our long-term fundamental methods, they have additional diversity of methods without the need for short-term timing.
For more information about our trading models (and their specific trading processes), click through at the bottom of this post for more information. Also, readers are invited to write to main at newarc dot com for our free, brief description of how we created the Stock Exchange models.
Expert Picks From The Models:
Note: This week’s Stock Exchange report is being moderated by Blue Harbinger, a source for independent investment ideas.
Holmes: This week I bought shares of WellCare Health Plans (WCG). It provides government sponsored managed care services. And for your information, I basically bought it on the dip, as you can see in the following chart.
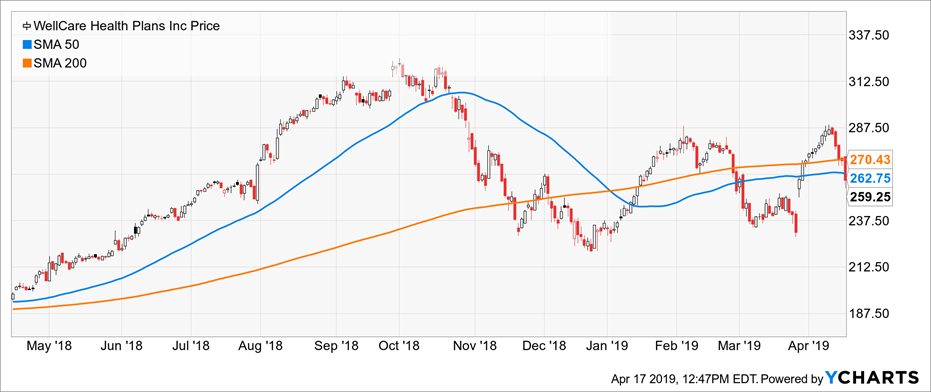
Blue Harbinger: Hey Holmes. Healthcare has been the worst performing sector this year, so you not only bought the shorter-term dip over the last week, but the sector relative performance dip so far this year.
Holmes: Thanks for that perspective. And as you know, I am a technical trading program (not a human) and my strategy usually involves a holding perioid of about 6 weeks.
BH: So you’re telling me that you don’t care too much for long-term (multi-year) data, such as the following FastGraph?
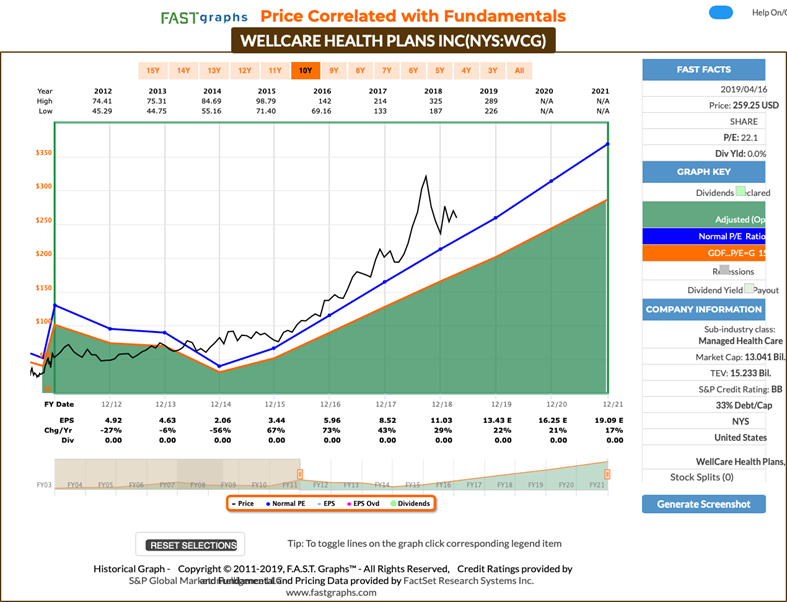
Holmes: I care, it’s just not my main focus. I’m a trader, not so much an investor. It’s about timeframe.
BH: Thanks for sharing, Holmes. And how about you, Road Runner–any trades to share with us this week?
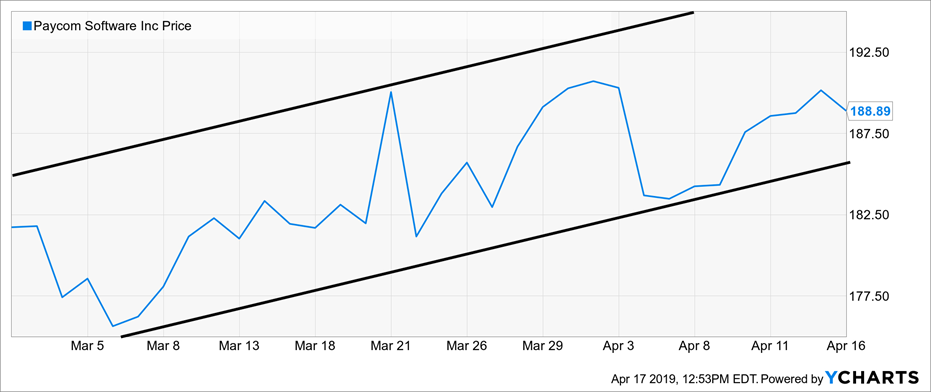
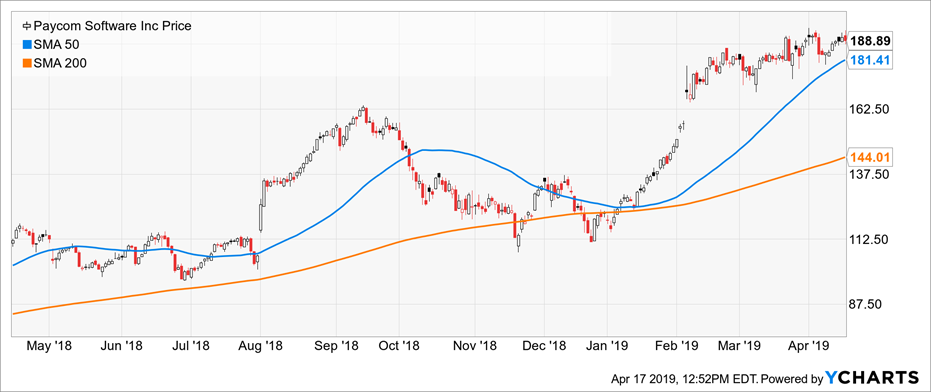
Road Runner: As you know, I am a momentum trader, and I like to buy stocks in the lower end of a rising channel. And as you can see in the following chart, I bought shares of Paycome (PAYC) this week. Ever heard of it?
BH: Yes, I’ve heard of it. They provide cloud-based human capital management (“HCM”) software service for small to mid-sized companies. And that’s basically the same thing as a company I’ve owned for the last few years, called Paylocity (PCTY). It’s an attractive business model because there’s a secular movement towards the cloud, a large total addressable market, and lots of room for growth. These companies are more focused on sales growth (acquiring new customers) than they are with profitability right now. And that’s fine because once they land a new customer, they tend to almost never lose them.
RR: That’s great information, but not all that valuable to me because my timeframe is different. I typically hold my positions for 4-weeks, and then I’m out.
Athena: While you two argue over which cloud-based HR and payroll processing company is better, I bought an energy stock this week. California Resources (CRC).

BH: If I am remembering correctly, that’s an Occidental Petroleum (NYSE:OXY) spin-off, and they serve the state of California exclusively. I liked the bonds a couple years ago when they were trading at a huge discount, but I suppose the stock is interesting now with energy prices going up. Aren’t they almost exclusively Brent in California? Here is the Fast Graph.
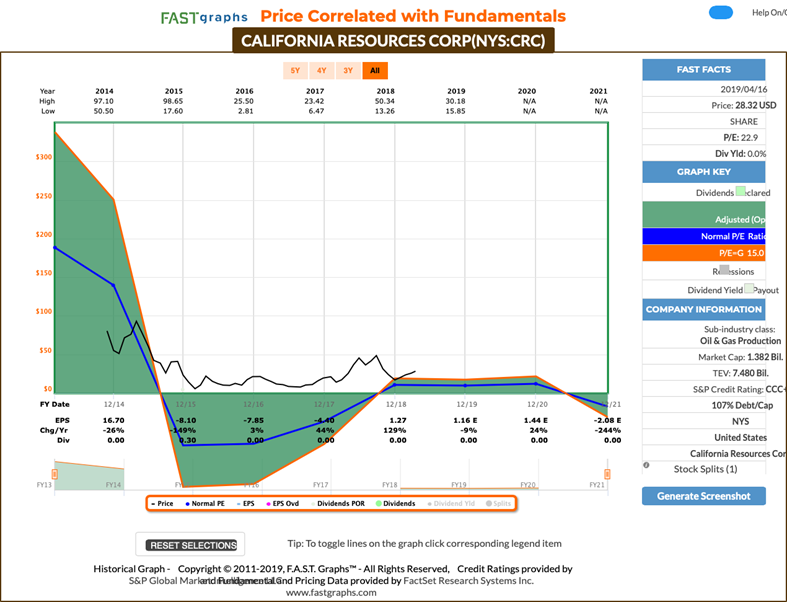
Athena: Thanks for running through your vague memories from two years ago, but I like this stock now, and I typically hold my positions for around 17-weeks. It’s all about the timeframe, BH.
Felix: In addition to my usually ranking (I ranked my top 20 from the Nasdaq 100 in the following table), I actually have a trade for you this week.

BH: Thanks for the list, I enjoy your rankings, but what’s your trade?
Felix: I bought share of Macquarie Infrastructure (MIC).

BH: Why? Are you chasing that big 9.9% dividend yield? Here is a look at the Fast Graph, by the way.
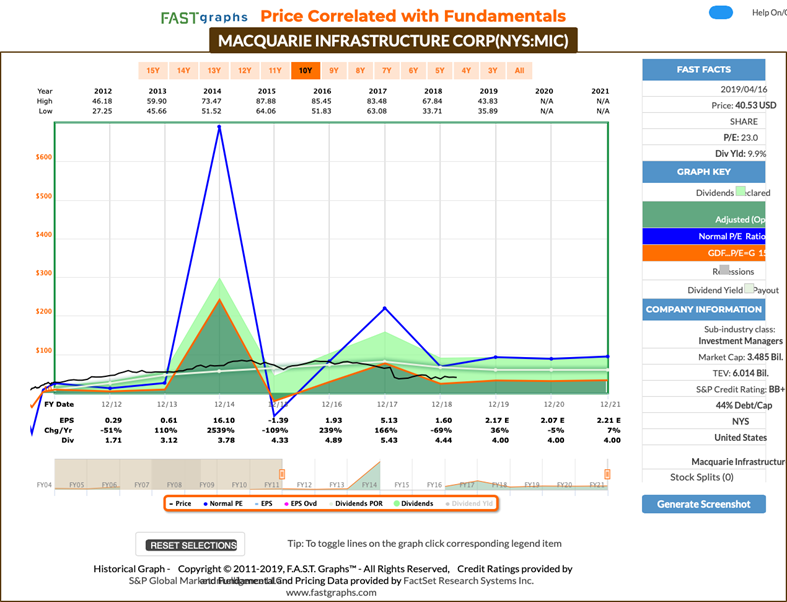
Felix: No. I am not chasing the dividend yield. Although I do typically hold long enough to receive a few quarterly dividend payments. Besides, there are better strategies for income. For example, you should check out Jeff’s enhanced yield program.
Oscar: I have some ETF rankings to share this week. As our resident sector/ETF rotation model, this week I ran our ” High Liquidity ETFs with price-volume multiple over 100 million per day” through my model, and the top 20 are ranked in the following list. For example, the oil ETF (USO (NYSE:USO)) is near the top of the list. That could bode well for Athena’s CRC trade.

Conclusion:
Different market participants have different trading and investing timeframes. And if you focus too much on information that isn’t geared towards your trading horizon it could influence you too make trades that aren’t consistent with your goals. Screening out information that isn’t relevant to your time horizon can be very difficult, but also very helpful. What is your trading time horizon?
Getting Updates:
Readers are welcome to suggest individual stocks and/or ETFs to be added to our model lists. We keep a running list of all securities our readers recommend, and we share the results within this weekly “Stock Exchange” series when feasible. Send your ideas to “etf at newarc dot com.” Also, we will share additional information about the models, including test data, with those interested in investing. Suggestions and comments about this weekly “Stock Exchange” report are welcome. Your can also access background information on the “Stock Exchange” here.