Over the last week, I have been noting that the silver chart has been the most instructive as to how the complex is running right now. While we certainly broke out over the initial 18 level resistance cited last week, the rally has provided us with yet another possible pitfall, at least until the market proves itself.
So, I will first discuss silver and GLD (NYSE:GLD) (which I am now aligning with the silver chart), and then I will discuss GDX (NYSE:GDX), which I think is quite messy right now.
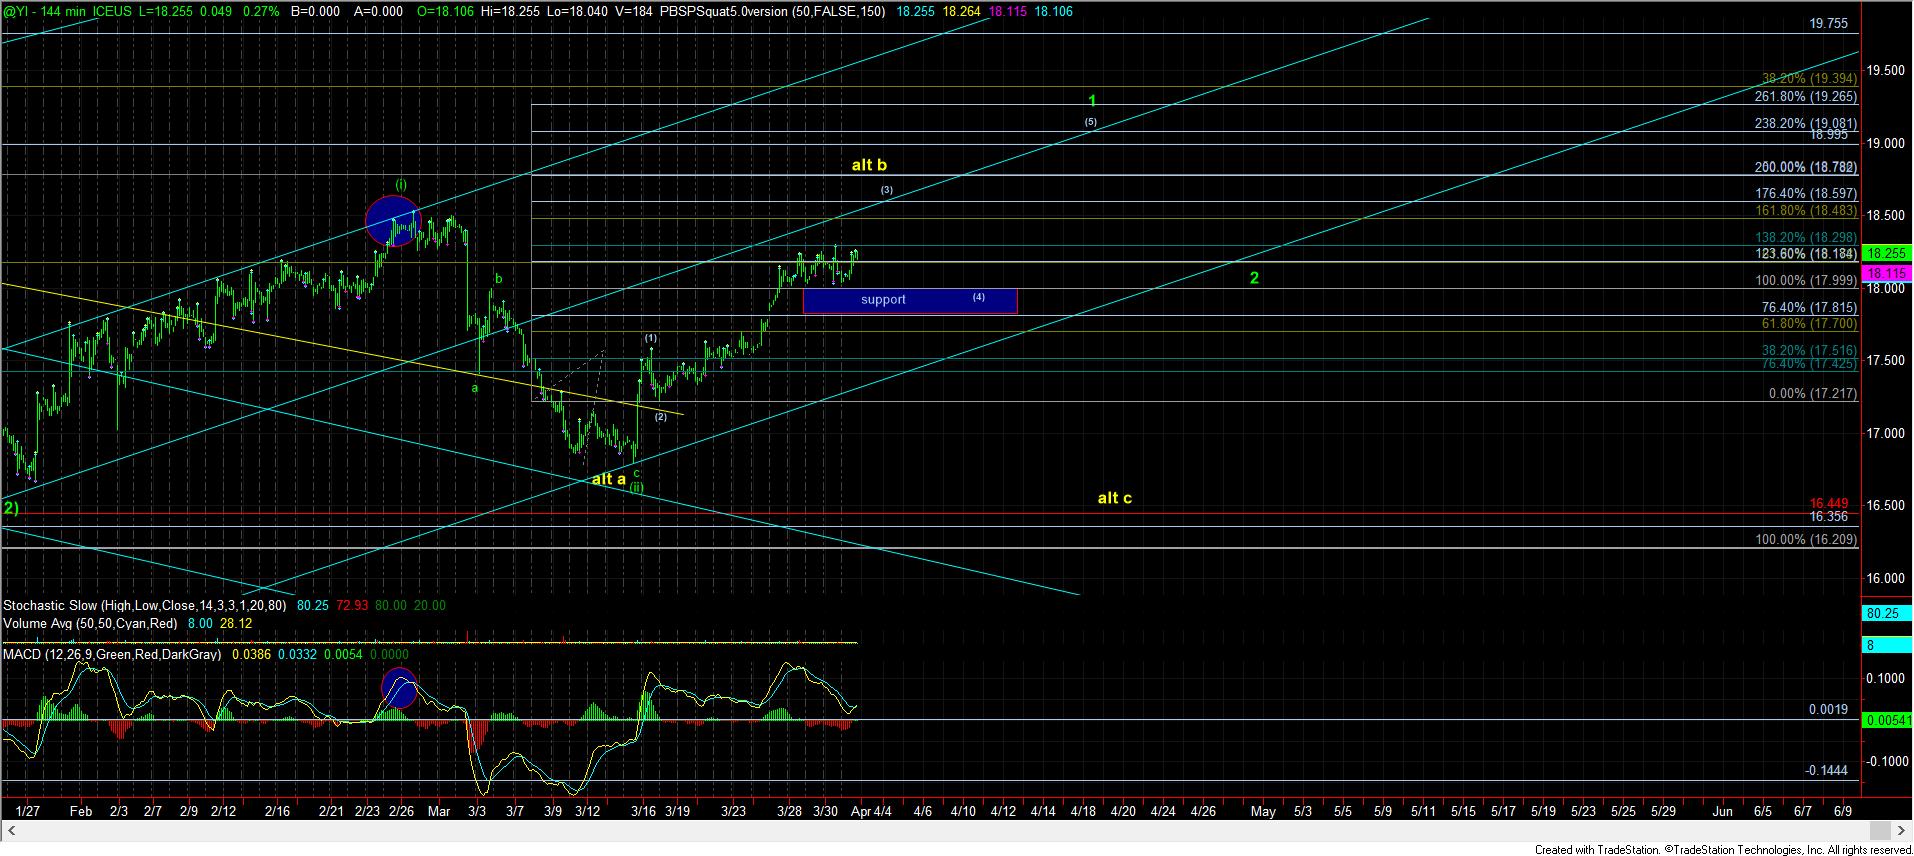
As you can see from the 144 minute silver chart, we still have not completed a larger 5 wave structure off the lows, which is what we now need to see once we broke through the 18 level. Right now, we seem to be set up for a small degree rally towards the target for wave (3) of 1, or, in the alternative, a b-wave top, as presented in the yellow count. The main dividing line between these two counts is whether silver holds support on a wave (4) pullback after completing wave (3), and then completes wave (5) within the next several weeks. However, a break down below support before 5 waves complete is going to be pointing me to a wave 2 flat, which is pointing us right back down to the 16.30-16.75 region in a c-wave decline.
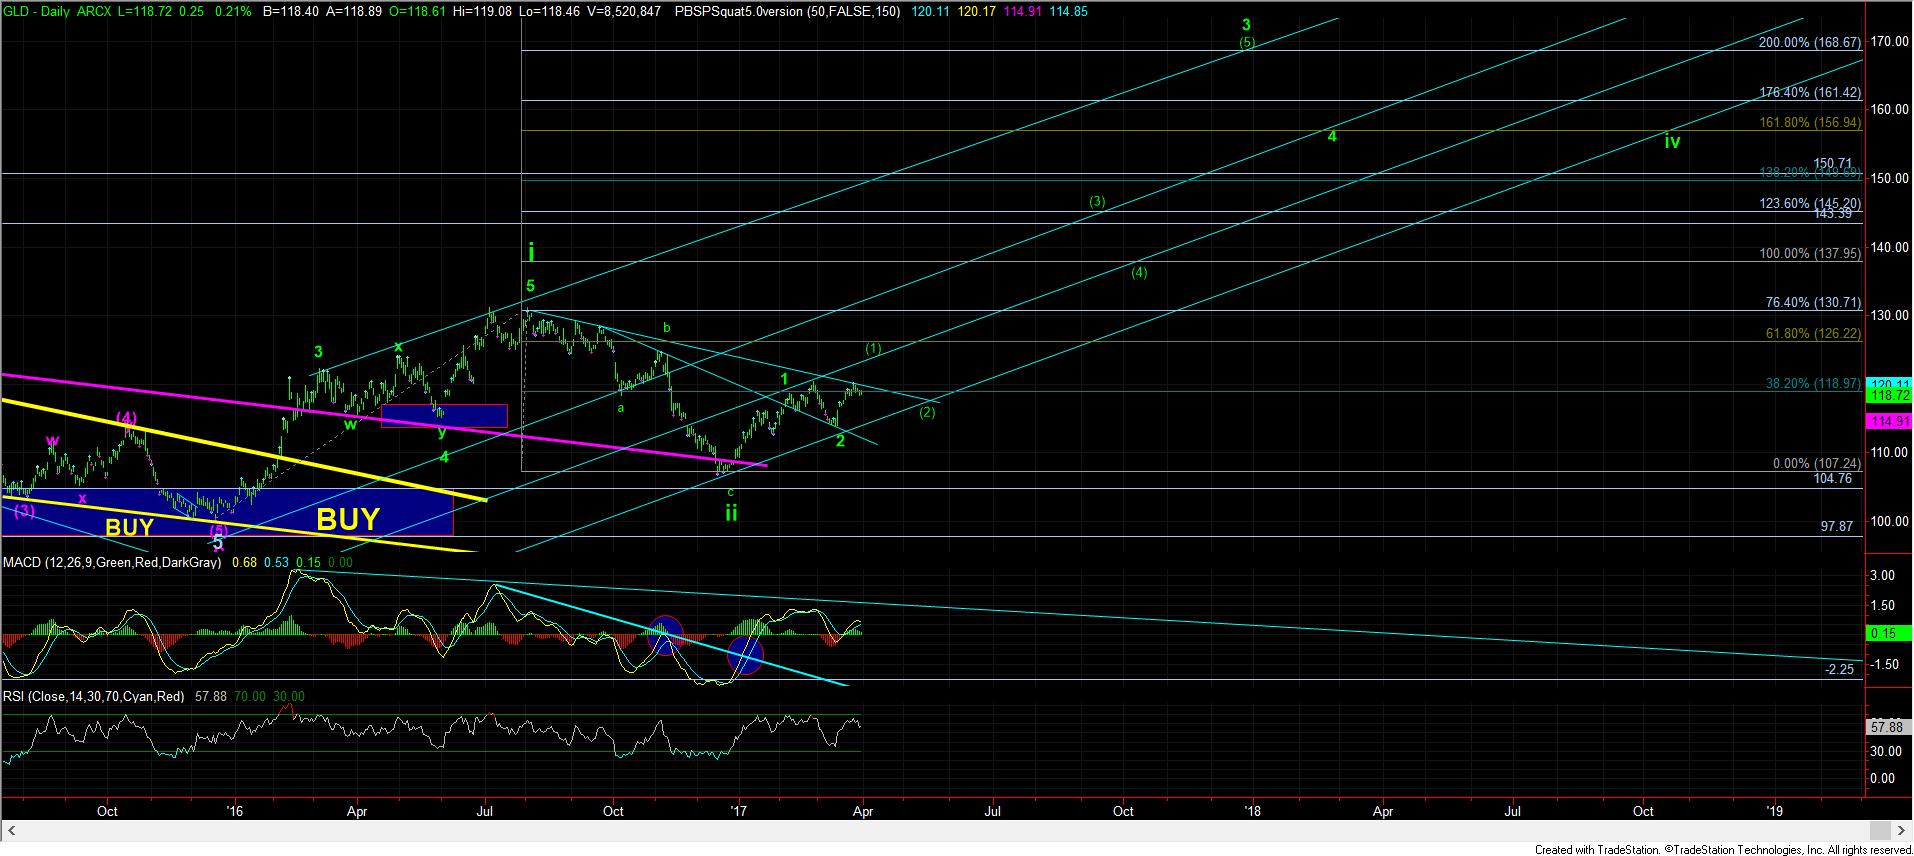
In the GLD, we have a similar set up, wherein we need to see GLD break out of the down trend line just overhead, and rally up towards the 122-124 region to complete wave (1) of 3 of iii. However, if we drop below 118 before the break out to the 122-124 region should occur, it would strongly argue for a c-wave of wave (2) back down to the 113/114 region.
Now, should these two charts be able to complete their respective immediate impulsive structures, then we can turn more aggressively bullish. However, I cannot suggest aggressive bullishness when we are only 3 waves up off the lows, and potentially set up for a really clean a-b-c flat structure pointing back down to the March lows. And, for those asking me, it is the completion of this next 1-2 structure in the complex (as presented in green on my 144-minute silver chart) that will get me sitting on the edge of my chair, and turning me more aggressively bullish in the near term. Until that completes, I am going to maintain a modicum of caution, and even hedge my portfolio again for one more potential drop.
When it comes to the GDX, I have to say that the smaller degree chart is a bit of a mess. Unfortunately, I am seeing a number of potential counts, and I cannot say which one is more probable at this time. For those reason, I will likely be taking cues from the more clear silver chart.
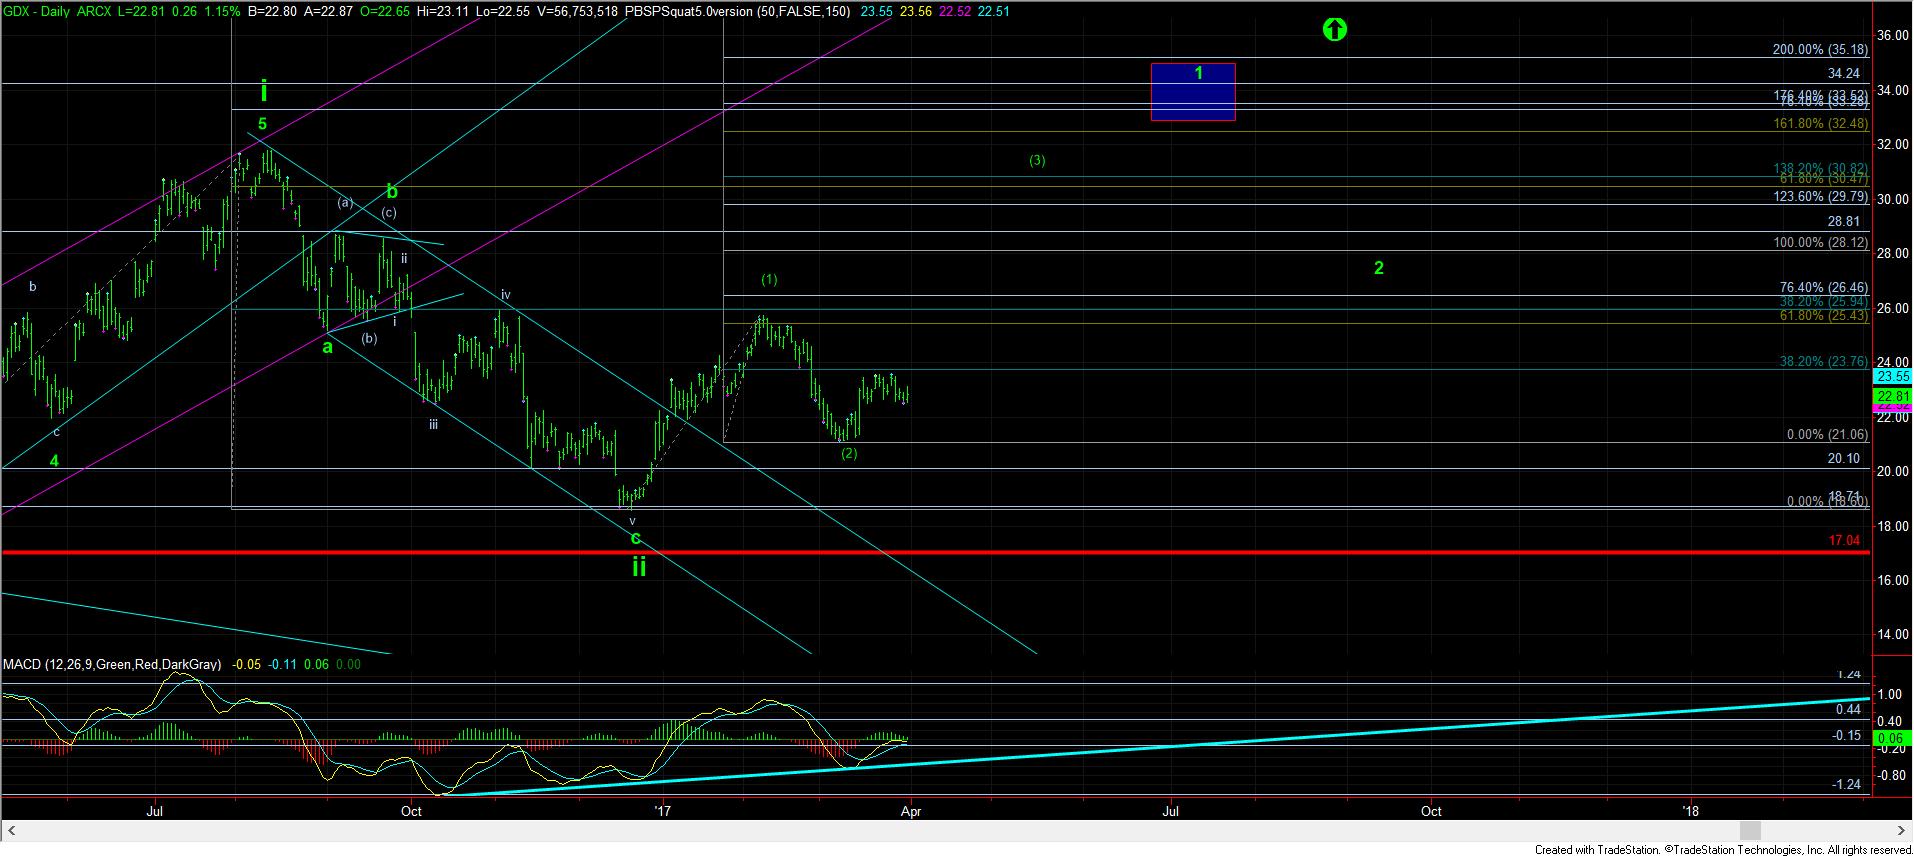
In the GDX, the immediate resistance resides between 23.40-23.85, which would be a target for the yellow b-wave. However, if we are able to move through the 23.85 level, then that would suggest the purple count or the green count is playing out. So, as you can see, there is not a lot of solid guidance being offered by the smaller degree structure on the GDX. And, sometimes, the market will hold its cards close to its vest, and will not provide clarity on the smaller time frames.
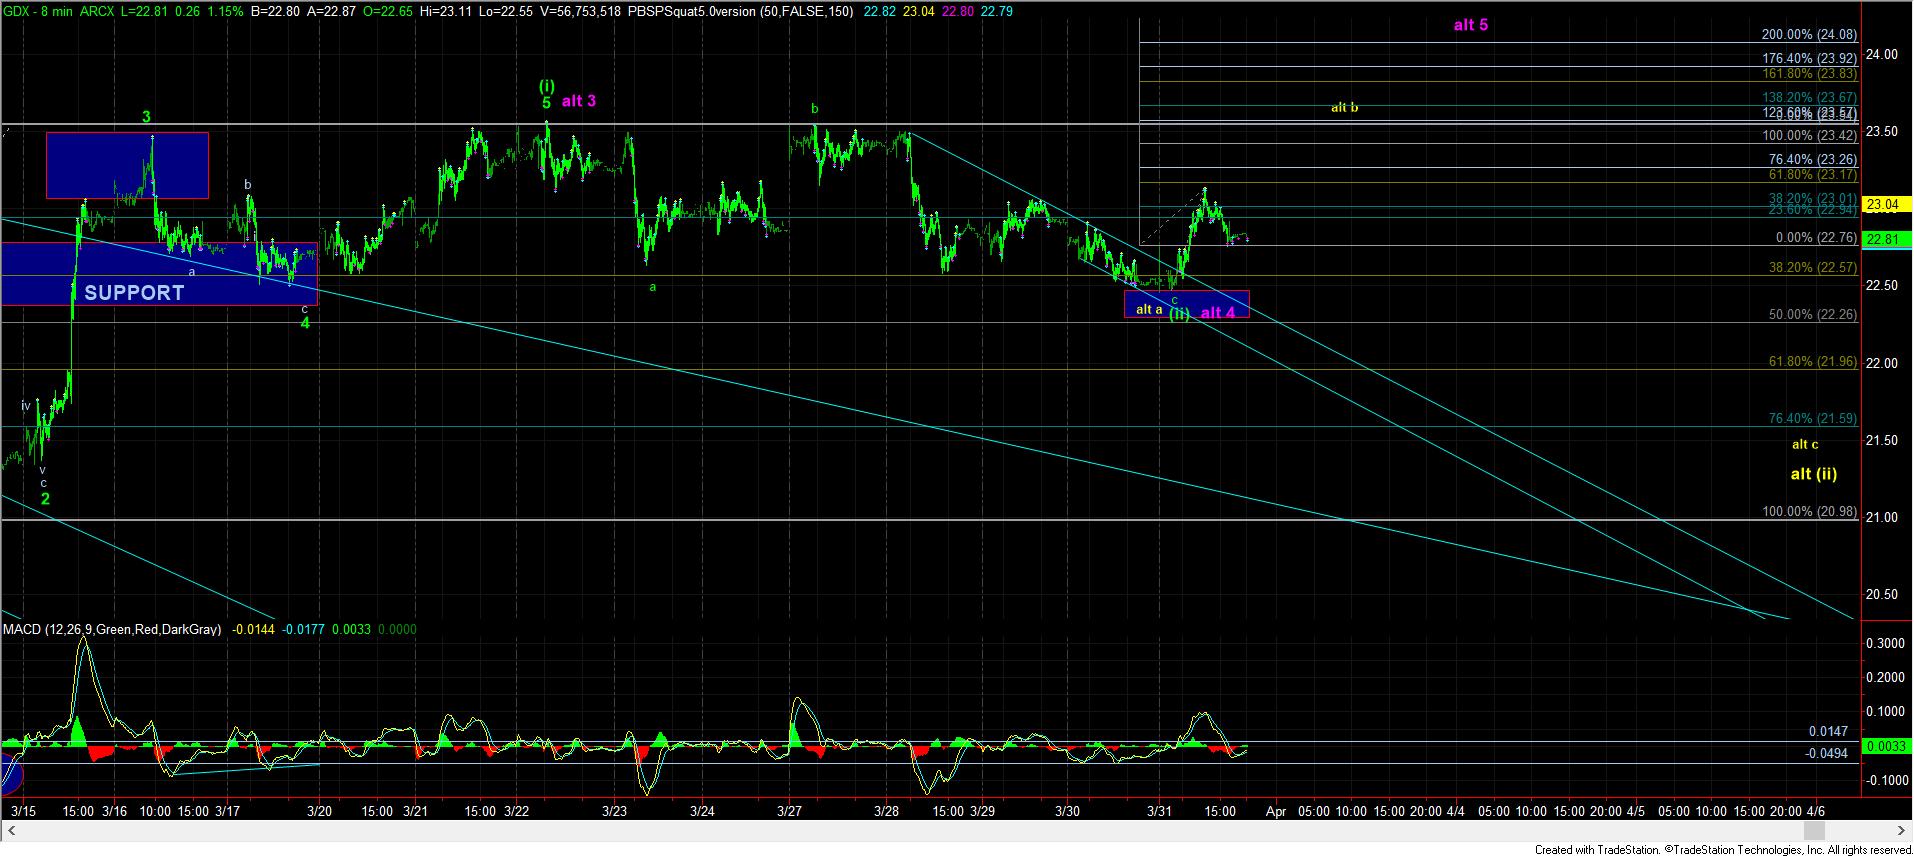
Ultimately, it would take a break out over 24.50 for me to move into the green count in a strong way, but I just don’t see that as the more likely outcome at this point in time. Consider that if the GDX is going to align itself with the bullish counts in silver and gold, then it probably means the purple count is more likely. However, if the next rally will provide a top in silver, then the yellow count is likely applicable across the entire complex. So, while we have been tracking the green count as the primary to date, based upon the way the rest of the complex seems to be playing out, I am not as confident of that count at this point in time. As I said before, there will be times we simply do not have clarity on the smaller time frames, and that is where we now stand regarding the GDX.
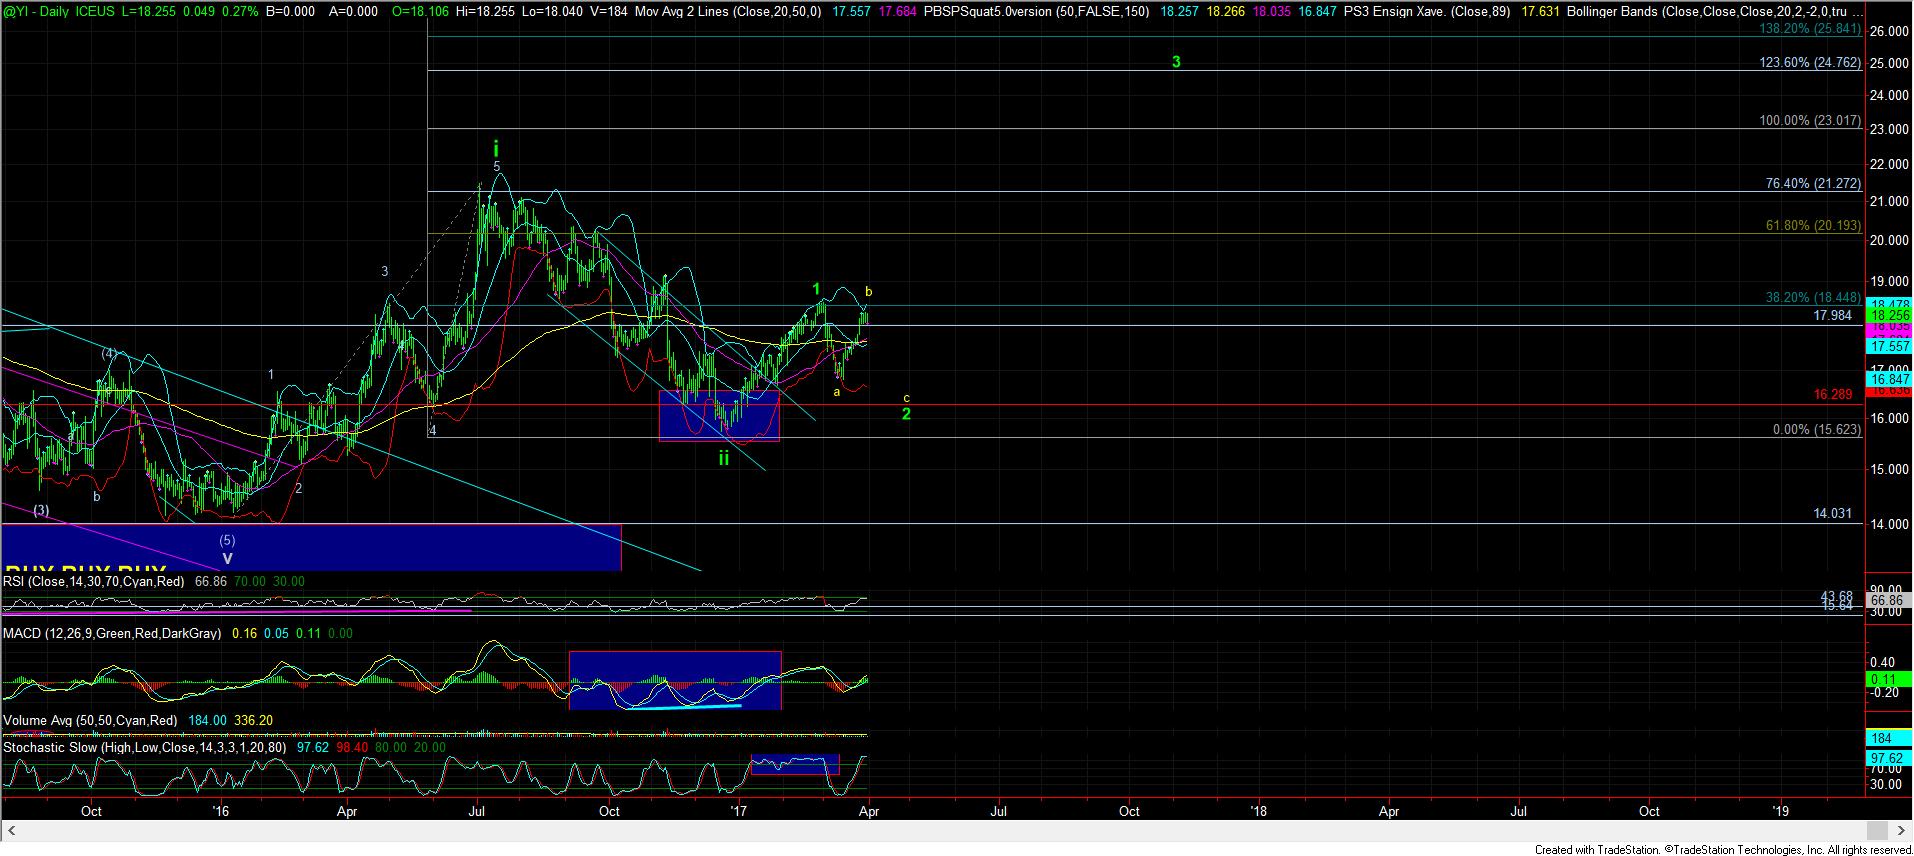
Personally, I see this smaller degree wave (3) in silver as providing a wonderful opportunity for those who choose to hedge their portfolios. If we do top in the yellow b-wave and drop down in a c-wave, then you should have some nice protection for your portfolio. However, if we hold support for wave (4), and then complete a 5 wave structure off that support, you can always extricate yourself from those positions on a 2nd wave pullback, assuming you buy enough time if you are using options.
In conclusion, I still do not have enough information to turn aggressively bullish just yet, at least in the shorter term. While I have reiterated many times that the larger patterns have provided us with 5 wave structures off the 2015 lows in the complex, and that keeps me longer term bullish, we have not resolved the smaller degree in this region to turn us immediately aggressively bullish just yet.
