Like an oak slowly growing in a stand of pines, the outgrowth of sentiment extremes become visible through major market inflection points. The irony, however, is seeing them. This is because on both sides of a market cycle there is a natural tendency for conditions otherwise thought abnormal to become commonplace.
As much as we try to anchor our baseline expectations with history, inevitably, paradigm creeps in as markets and sentiment slowly become stretched beyond more rational assumptions.
They couldn’t see the trees for the forest – until the forest caught fire.
In the late 1990’s as venture capital was seeding manic entrepreneurs with otherwise outrageous business plans, perspective was forsaken for the chance to become the next internet giant. A short time down that road, the pursuit of Amazon (NASDAQ:AMZN) quickly gave way to the likes of Clickmango, your one-stop shop for all of your succulent produce desires, and LifeJacketStore.com – well, for your many recreation flotation demands…
Fast-forward a decade later and the opposite side of the continuum, the raging fires of the financial crisis warped investors expectations into believing that a steady state of chaos would erode markets for the foreseeable future. So powerful were these kinetic events that the same anxieties still haunt participants today, even as economic conditions here in the US and abroad have little resemblance to that time and their unfounded fears over the past seven years have largely remained unrealized.
We’ve come a long way when it comes to market expectations of historically low yields. Before the financial crisis hit in 2008, the lower range for the 10-year Treasury yield was around 150 bps below at just above 3 percent. When it plunged to around 2 percent in the bowels of the financial crisis, the thought of an even deeper slide below that threshold was inconceivable – even as the threat of deflation was at its height. In fact, at that time, conventional wisdom believed inflation was the next risk for the economy and markets as the Fed led the world and began applying extraordinary monetary accommodations to bridge the gap across the crisis.
Simply put, on both sides of the continuum, our collective behavior is often realized in the markets with a latent reflexive chase down a dark tunnel with an oncoming train. Today, we’d argue that participants gamble down the tunnel has been darkened by the now universally accepted exceptionally low yield market environment and that the train approaching is inflation.
In this analogy, the sentiment extreme that has brought nearly half of the global government bond market to negative yields is an inverse equivalent of the speculative mania during the dotcom era that ushered in companies like Clickmango and LifeJacketStore.com – right before the bubble burst in 2000.
One period was propelled with exuberance and the other by fear. Another distinction is that the immediate risk in the market is largely institutionally (both public – central banks and private – pensions, insurance companies and banks) held today, whereas, in 2000 retail investors became the bag holders of last resort.
With a reasonable chance that core CPI in the US will make a push above 2.5 percent later this year, who in sound mind would expect even a positive intermediate return on Treasuries, no less a longer duration note like the 10-year?
But alas, the relative attraction to Treasuries here in the US where the 10-year still yields around 160 bps above German bunds is enough for most "conservative" investors.
Just keep in mind that the US introduced the deflationary threat by igniting the fires in housing and is leading the way out – as the inflation data continues to suggest. As always, Fed policy has lagged on both sides of the cycle, but the notion that bonds remain attractive today because of disinflation and deflationary conditions/concerns is as reasonable as shorting them was in the wake of the financial crisis with fears of hyperinflation.
The reality is it's been a “Costanza” market since that time and we see no reason to believe conventional wisdom will get it right today.
George: “My life is the complete opposite of everything I want it to be. Every instinct I have in every aspect of life, be it something to wear, something to eat… It’s often wrong.”Jerry: ”If every instinct you have is wrong, then the opposite would have to be right.”
- Seinfeld, "The Opposite" (1994)
Do we expect a return to "normal" where the 10-year yields over 4 percent or the fed funds rate is materially above 2 percent? No. Expectations were pushed too high over the past two years and as seen yesterday with the Fed’s new dot-plot projections for June, have continued to drift lower as expected.
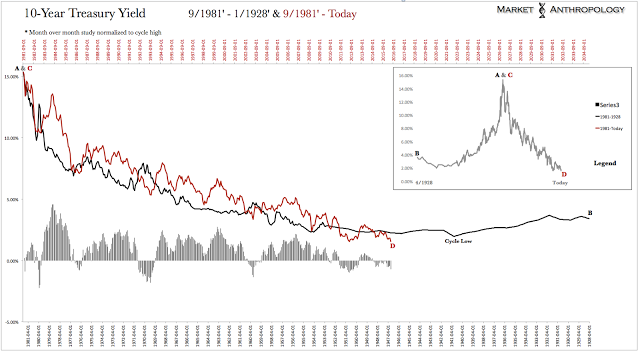
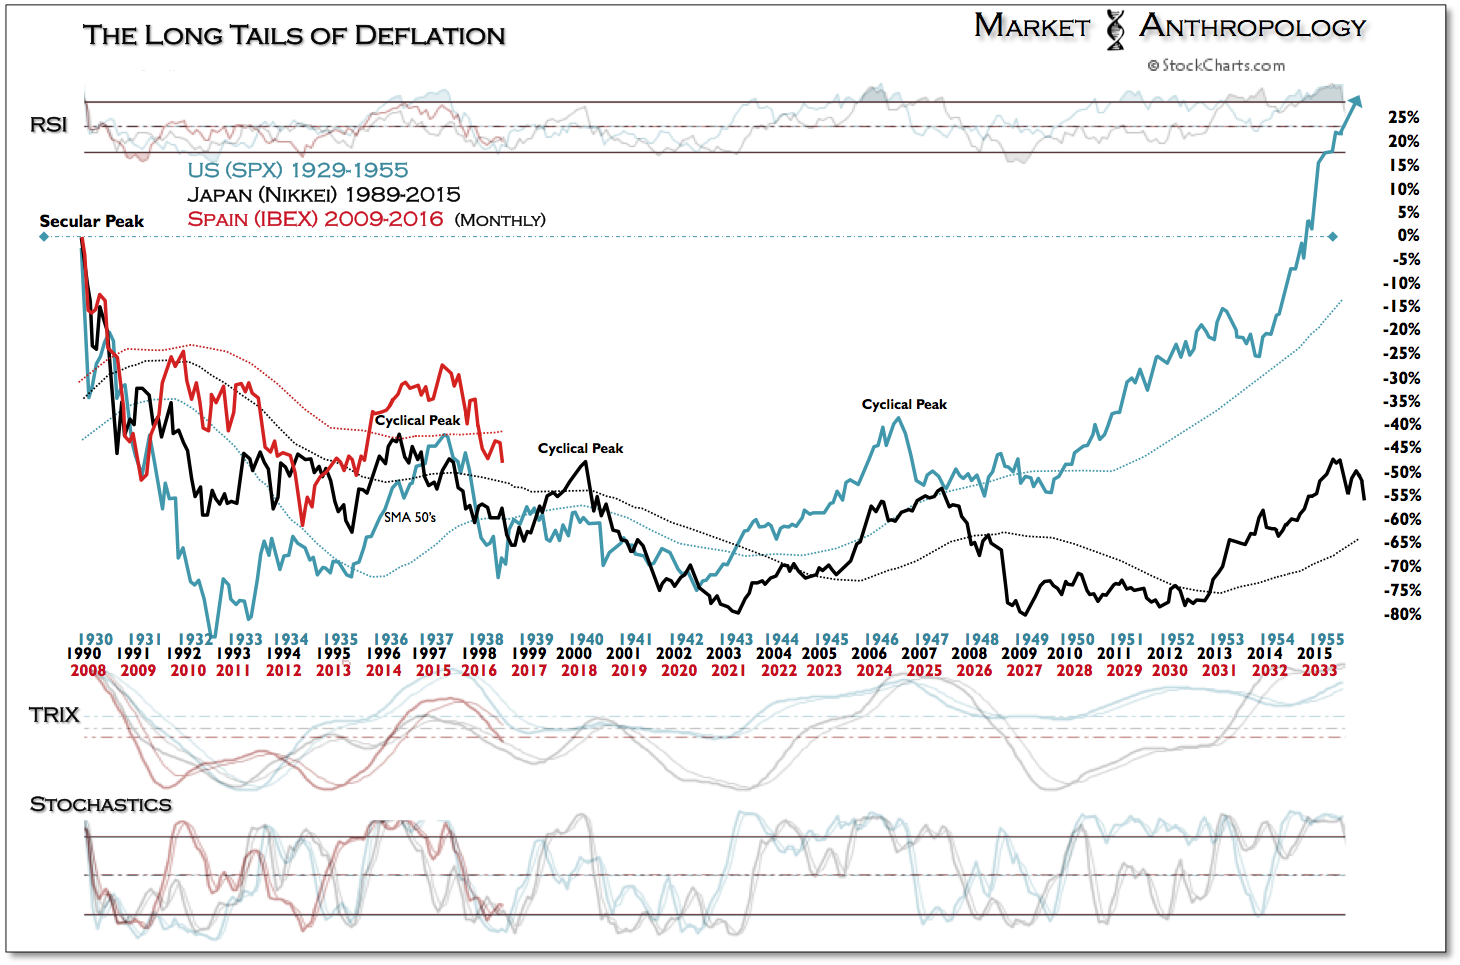
Moreover – and as shown below with our comparative profile of the last time yields fell into the long-term cycle trough in the 1930’s and 1940’s, they still have a ways to go in aligning expectations with reality. 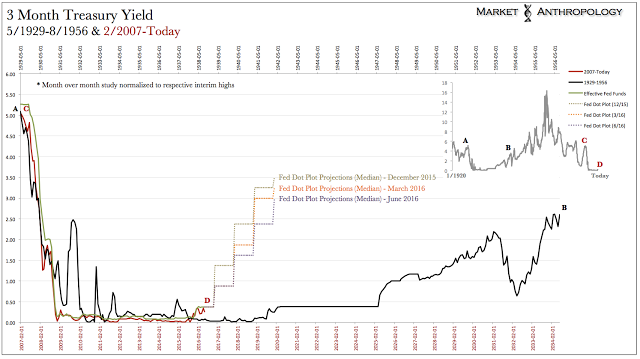
The twist, however, is long-term yields have now been pushed to the bottom of the range by the latent reflexive move. Our best guess – and an opinion we have held since the end of 2013, is that the 10-year yield will remain range bound between 1.5 and 3 percent for the foreseeable future, as markets and economies work across the transitional divide to the next major secular growth cycle.
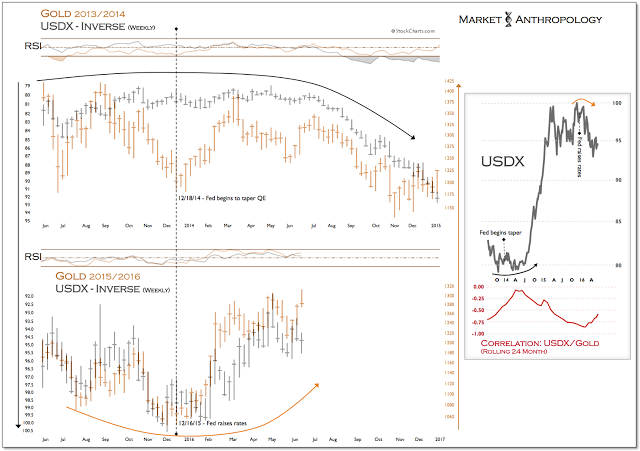
With precious metals continuing to lead the move higher in the commodity sector this year and with the US dollar poised to fall further, the inflation vane continues to point higher – despite the Costanza concerns with disinflation and deflation today. All things considered, we would conservatively speculate that the 10-year yield will snap back to the return profile of the long-term cycle around 2.25 percent.
Postscripts
The British are coming! The British are coming! The British are coming!
With the Brexit vote on tap for next Thursday, we see a resolution for the markets heightened anxieties and not a revolution to leave the EU. Over the past few weeks, concerns have snowballed that Britain will choose to leave. Our best guesstimate is they're widely off the mark, and we expect a strong snap-back reaction to develop in the markets next week. Broad brush, over the short-term this would likely be bullish for equities and bearish for bonds and gold.
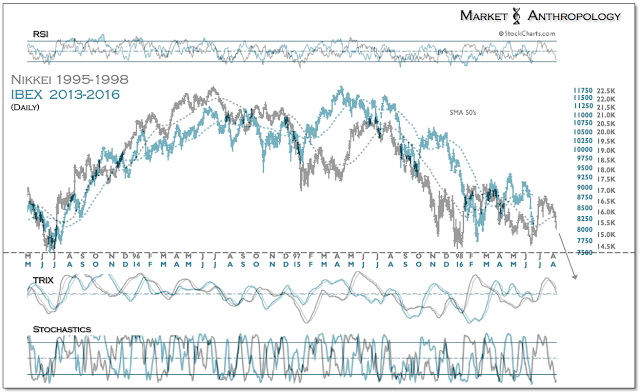
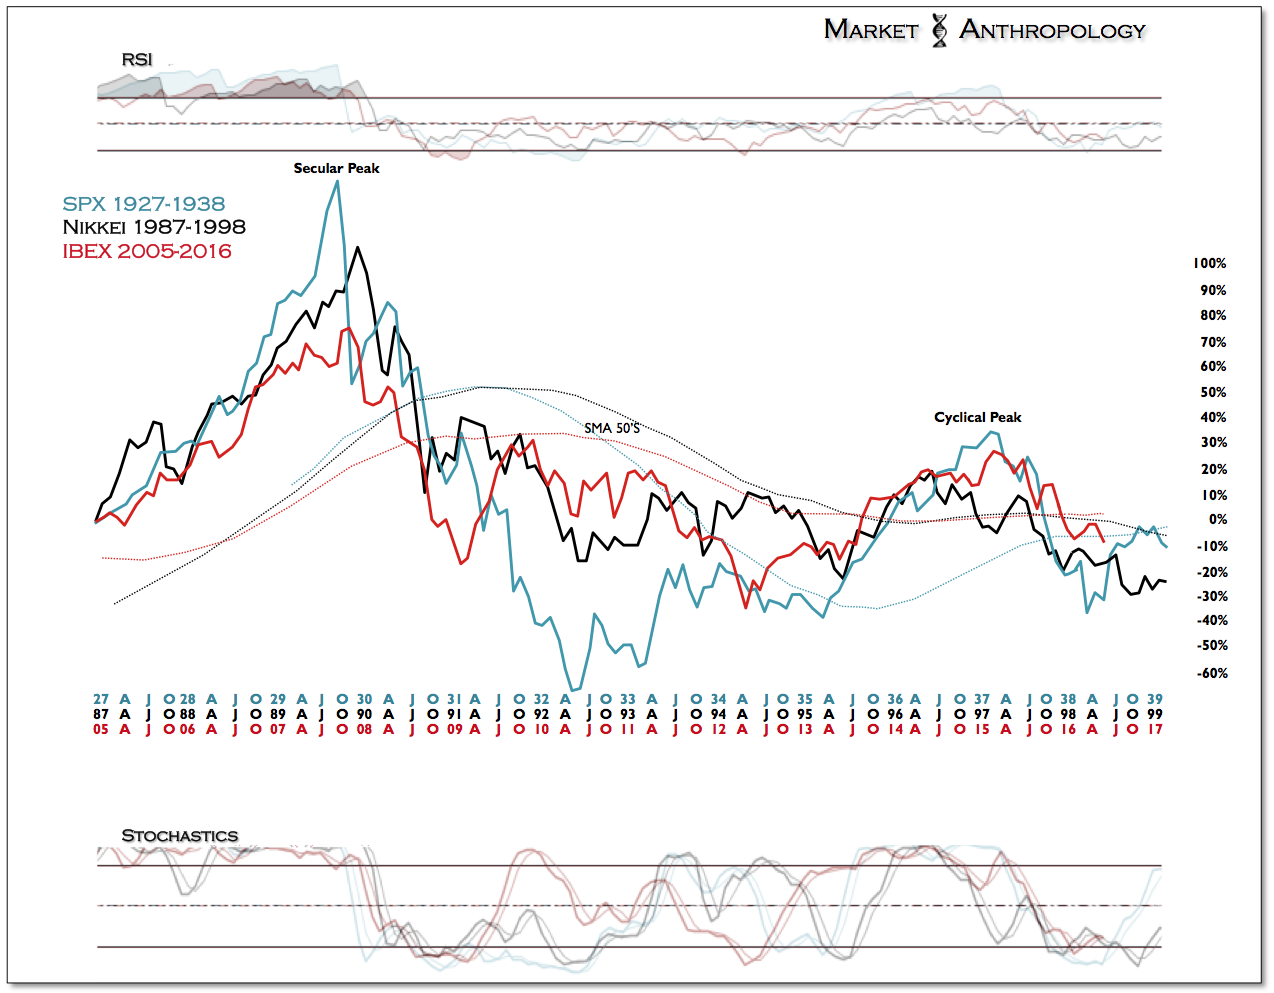
Taking a speculative swing with potentially longer-term opportunities, we cautiously like the prospects for higher beta equity markets over the short-term, such as Spain's IBEX. Moreover, our momentum comparative that we've followed over the past three years for the IBEX points towards an interim low, with the possibility that its cyclical decline has run its course.
With the euro finding a foothold in today's session, we like the iShares MSCI Spain Capped (NYSE:EWP) ETF, that would also benefit from a stronger euro. For potential longer-term investors, the ETF pays a hefty 4.25 percent dividend.
The US dollar index, which we had expected to retrace lower coming into June, continues to flirt with the bottom of the range (~93) of the broad top it has traded in over the past two years. Should the vote in Britain fail next week, we'd expect the euro to find strength and the US dollar index to weaken.
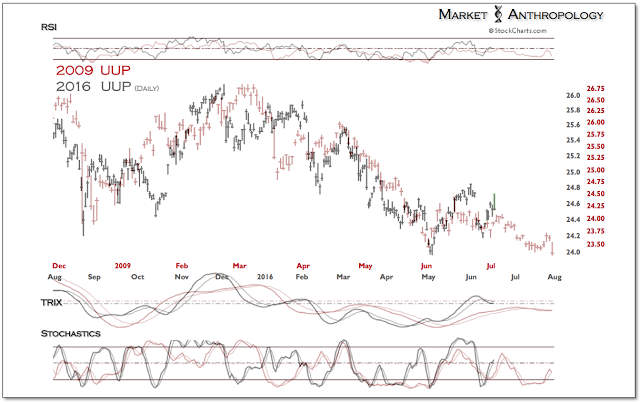
Our dollar index comparative from 2009 also points towards further weakness and a breakdown below support of its broad top.
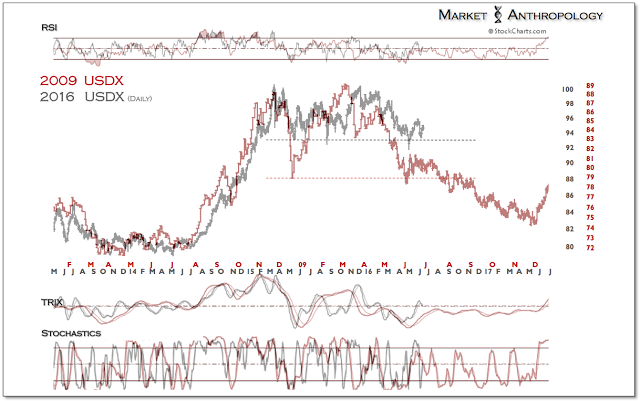
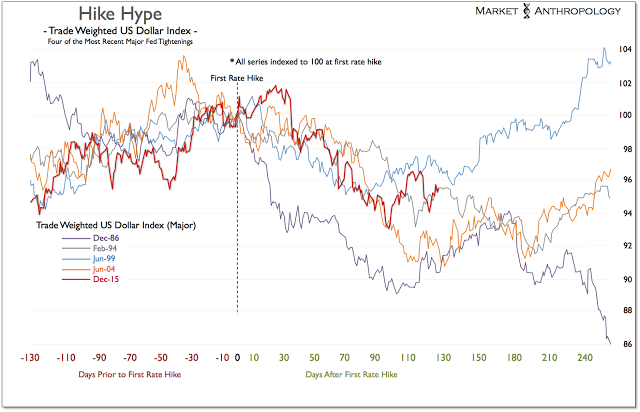
Although gold may have reached another interim high this week, we are still long-term bulls on both gold and silver and point towards further weakness in the dollar in tempering their potential retracement declines.
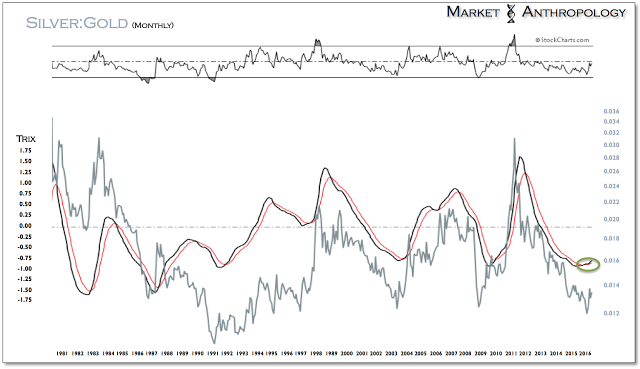
Moreover, the silver-gold ratio's rare positive momentum cross remains broadly bullish towards the reflationary trend that gold had led initially this past December. Should the trend in inflation step higher through the end of the year, we expect silver will continue to outperform.
