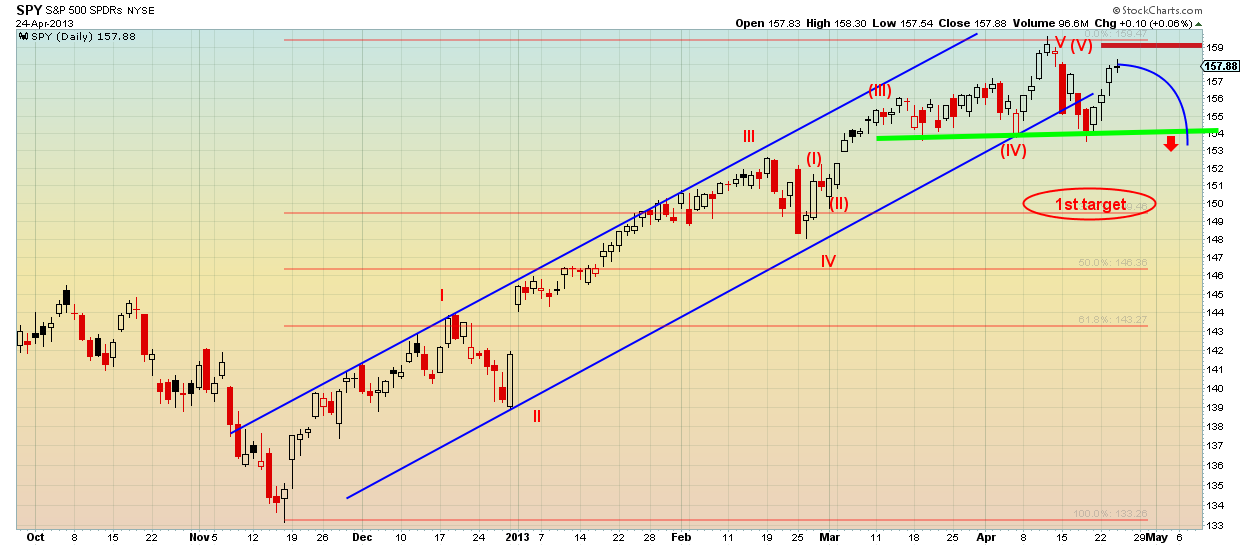
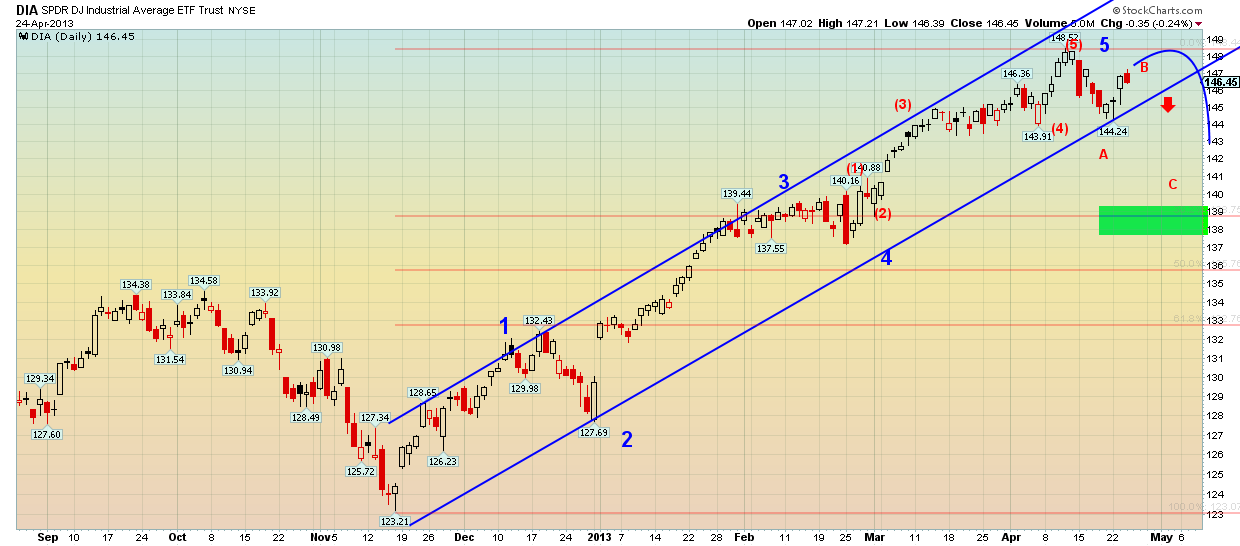
The S&P 500 SPDR ETF (SPY) and the Dow Jones Industrials ETF (DIA) despite the recent violent pull back towards April lows, are now just a few points away from their respective highs. The overall structure of the rise from last November looks complete according to our Elliott wave analysis. We see in both a very good possibility that the top is in and that the move from the past November is over. Although prices remain inside the rising trend channel, we believe it's time for a correction. Nevertheless, for our analysis to come true, support levels must be broken.
SPY, although it pushed outside of the rising trend channel, has only pushed below support levels during the intraday movement and there is no close below support. However, this was the first time prices moved below the level (153,77) that produced a new high (159.71). It is important and vital to the bearish scenario to see if a new high is made.
It is also important to note that the decline from highs is most probably in 3 waves. This is not good for the bearish scenario. However this decline could be only the first part of the correction (wave A), with the second part of the correction (wave B) underway. If our analysis comes true, next we should expect a decline as wave C to break the green support level. The first support below that is the 38% retracement.
DIA on the other hand has not broken the upward sloping channel. However the wave count here is very similar to that of SPY.
The same applies to DIA. The bearish scenario will increase its chances of success if prices break downward outside of the upward sloping channel.
With this analysis we are not trying to be the only ones making sure that the top is in. We do not have a preference for the market to continue upward or downward. We only want to point out the important levels and the most probable scenarios in order to make profitable trades.
We always respect resistance and support levels and we are always ready to change our view if a level is breached. The main point we try to show from this analysis is that markets have traveled for a long time in a rising trend. The rise has a form that makes us believe that bulls will need to be ready to cover their positions in order to protect themselves. The more this rise continues, the more possible it is we are nearing an intermediate top and the more we will see prices fall to make a correction.
Disclosure: None of the information or opinions expressed in this blog constitutes a solicitation for the purchase or sale of any security or other instrument. Nothing in this article constitutes investment advice and any recommendations that may be contained herein have not been based upon a consideration of the investment objectives, financial situation or particular needs of any specific recipient. Any purchase or sale activity in any securities or other instrument should be based upon your own analysis and conclusions.
- English (UK)
- English (India)
- English (Canada)
- English (Australia)
- English (South Africa)
- English (Philippines)
- English (Nigeria)
- Deutsch
- Español (España)
- Español (México)
- Français
- Italiano
- Nederlands
- Português (Portugal)
- Polski
- Português (Brasil)
- Русский
- Türkçe
- العربية
- Ελληνικά
- Svenska
- Suomi
- עברית
- 日本語
- 한국어
- 简体中文
- 繁體中文
- Bahasa Indonesia
- Bahasa Melayu
- ไทย
- Tiếng Việt
- हिंदी
SPY And DIA Elliott Wave Analysis
Published 04/25/2013, 07:03 AM
Updated 07/09/2023, 06:31 AM
SPY And DIA Elliott Wave Analysis
3rd party Ad. Not an offer or recommendation by Investing.com. See disclosure here or
remove ads
.
Latest comments
Install Our App
Risk Disclosure: Trading in financial instruments and/or cryptocurrencies involves high risks including the risk of losing some, or all, of your investment amount, and may not be suitable for all investors. Prices of cryptocurrencies are extremely volatile and may be affected by external factors such as financial, regulatory or political events. Trading on margin increases the financial risks.
Before deciding to trade in financial instrument or cryptocurrencies you should be fully informed of the risks and costs associated with trading the financial markets, carefully consider your investment objectives, level of experience, and risk appetite, and seek professional advice where needed.
Fusion Media would like to remind you that the data contained in this website is not necessarily real-time nor accurate. The data and prices on the website are not necessarily provided by any market or exchange, but may be provided by market makers, and so prices may not be accurate and may differ from the actual price at any given market, meaning prices are indicative and not appropriate for trading purposes. Fusion Media and any provider of the data contained in this website will not accept liability for any loss or damage as a result of your trading, or your reliance on the information contained within this website.
It is prohibited to use, store, reproduce, display, modify, transmit or distribute the data contained in this website without the explicit prior written permission of Fusion Media and/or the data provider. All intellectual property rights are reserved by the providers and/or the exchange providing the data contained in this website.
Fusion Media may be compensated by the advertisers that appear on the website, based on your interaction with the advertisements or advertisers.
© 2007-2024 - Fusion Media Limited. All Rights Reserved.
