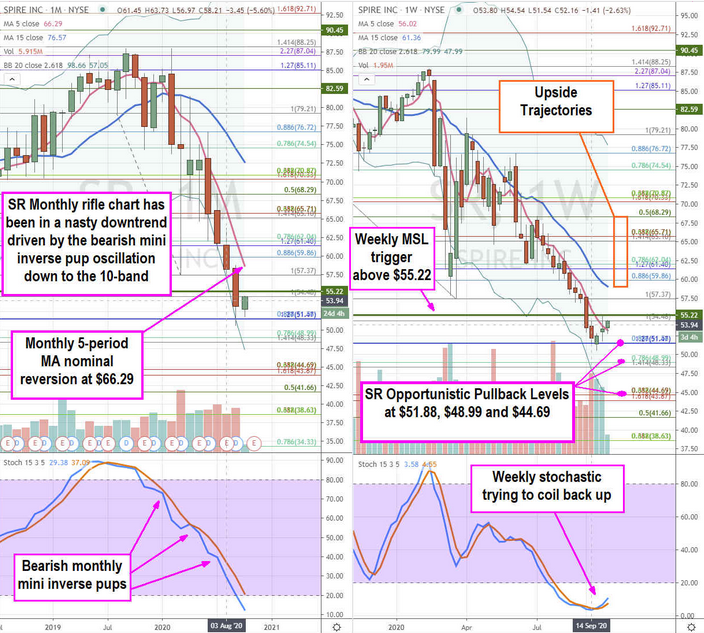
Natural gas utility Spire (NYSE:SR) shares have been in a nasty sell-off with the rest of the gas utility sector severely underperforming the benchmark S&P 500 index. The energy, oil and gas sector has been extremely weak as even blue-chip leaders like Exxon Mobil (NYSE:XOM) and Chevron (NYSE:CVX) are making decade lows due to the trend in alternative energy solutions. Seasonality also plays a major role in these stocks. Shares of Spire have taken excessive downdrafts, which warrants a look at opportunistic pullback levels for short-term nimble traders seeking to capitalize on price reversions.
Q3 FY 2020 Earnings Release
On Aug. 5, 2020, Spire released its fiscal third-quarter 2020 results for the quarter ending June 2020. The Company reported an earnings-per-share (EPS) profit of $0.07 excluding non-recurring items matching consensus analyst estimates for a profit of $0.07.
Revenues fell (-0.1%) year-over-year (YoY) to $321.1 million beating analyst estimates for $313.51 million. The net loss for the quarter was (-$92 million), which reflects (-$149 million) in impairment charges for Spire Storage and (-$8 million) write-down for commercial compressed natural gas CNG fueling stations in Greer, SC.
The Company has begun and orderly process of winding down and exiting the Greer facility in the next 12-months as low diesel prices have made the conversion of Class eight trucks financially inconducive.
Conference Call Takeaways
Spire CEO, Suzanne Sitherwood, emphasized the role of Spire being an essential business. Since the winter months are the peak season for natural gas heating, the coronavirus pandemic start in February contributed to the drop in business demand ahead of its usual seasonal drop. Spire is the fifth largest publicly traded natural gas company servicing 1.8 million homes and businesses across three states: Alabama, Missouri and Mississippi. Two of these regions were COVID-19 hotspots during the quarter.
Spire generated $453.8 million in cash for the quarter, up 3% YoY. The Company also had to refund a one-time $15 million refund to customers due to Missouri regulatory ruling disallowing certain infrastructure upgrade expenses.
The eco-friendly electronification trend also affects utilities spurring debate over electric heating versus gas heating. In the foreseeable future, natural gas is much more efficient. The Company noted “Direct use of natural gas is more efficient energy from when converting natural gas or fossil fuels to electricity (91% vs. 36%).” Bottom line is it’s easier and cheaper to use natural gas than to fine a way to use electricity for heating.
Due to the COVID-19 pandemic triggering an earlier than normal drop in natural gas demand starting in March coupled with demand and production uncertainty heading into winter, the Company almost doubled storage commitments locking the seasonal price differential. This will result in higher fixed storage costs until the gas is used this winter.
Flat Guidance
The Company forecasts full-year fiscal 2020 EPS range of $3.70 to $3.75 versus consensus analyst estimates of $3.71. Spire expects total impacts of COVID-19 to be approximately $6.2 million or $0.09 per share stemming from a drop in commercial demand and increased bad debt costs.
Customer past due balances rose by $3.8 million in the quarter and Spire expects to rollout enhanced payment options. The Company raised FY 2020 capex to $650 million. Long-term NEE per share growth is targeted to 4% to 7% based on 7$-8$ growth in utility rates. Sept. 30, 2020, Stifel upgraded Spire to a buy from a hold rating. Nimble traders can watch for short-term pullback opportunities to capture reversions.

SR Opportunistic Pullback Levels
Using the rifle charts on the monthly and weekly time frames provides a broader view of the landscape for JBL stock. The monthly rifle chart has been in a strong downtrend since mid-2019 as every stochastic coil attempt has been rejected into mini inverse pups.
The full monthly stochastic oscillation down has reached the deeply oversold 10-band. The weekly rifle chart has started to attempt a bounce with a market structure low (MSL) buy trigger if the $55.22 price level can breakout.
The weekly stochastic has bottomed out and crossed back up but needs to break through the 20-band to get any follow through. Nimble traders can look for opportunistic pullback levels at the $51.88 fib, $48.99 fib and the $44.69 fib. The upside trajectory range on the weekly MSL trigger buy above $55.22 is the $61.36 weekly 15-period MA to the $68.29 Fibonacci (fib) level.
