Market Review And Update
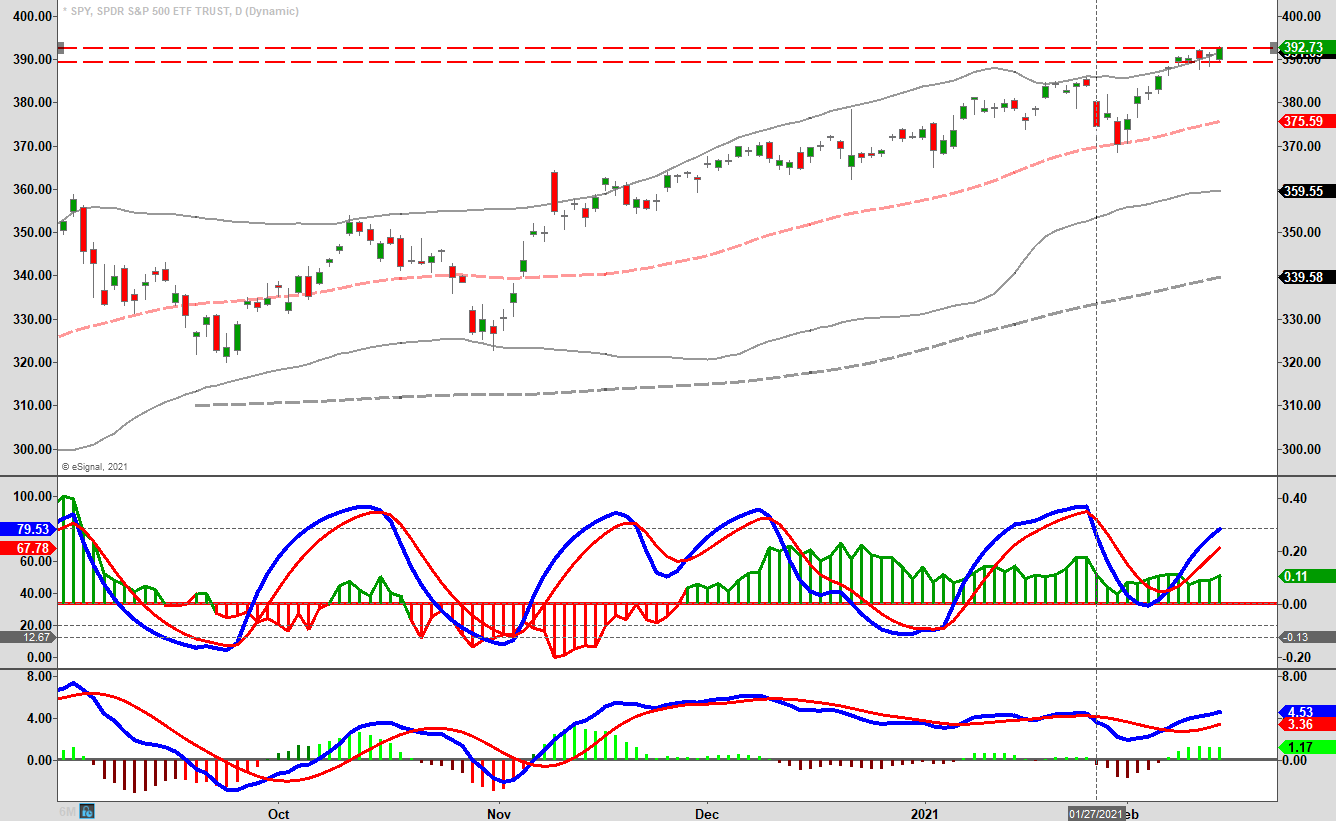
Last week, we discussed how the market successfully retested and held the 50-dma and rallied enough to turn money flows back positive. We addressed this point on Thursday in our daily “3-Minutes” video.
“While the money flow ‘buy signal’ will likely trigger next week, the market is already trading 2-standard deviations above the 40-dma. Such suggests that the upside may be more limited over the next couple of weeks.”
As the market struggled to hold gains, as denoted by the two red-dashed lines, that was the case. Notably, the entire week’s gains came in the last hour of trading on Friday.
With the money flow signals still positive, the overall bias to the market remains bullish for now. However, the rally is still at risk currently, given the more extreme overbought and bullish conditions. Speculation remains rampant, and there are many indicators from relative strength to participation that suggest we could see another correction in March or early April.
When our money flow indicators turn lower again, we will suggest reducing risk accordingly. However, the problem with all technical indicators is two-fold:
- They don’t distinguish between a 5% correction and a 20% drawdown; and,
- Secondly, the corrections often occur so quickly you don’t have much time to decide just how defensive you need to be.
Speculative Mania Goes “Up In Smoke”
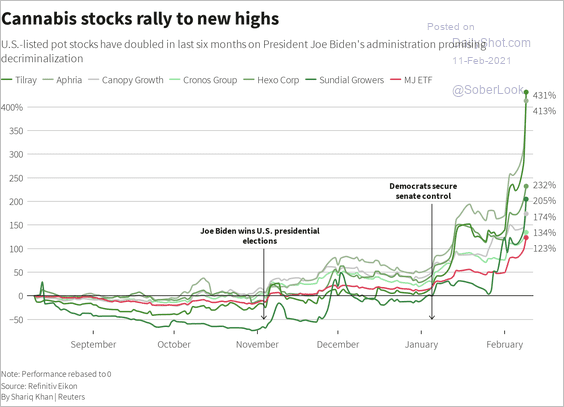
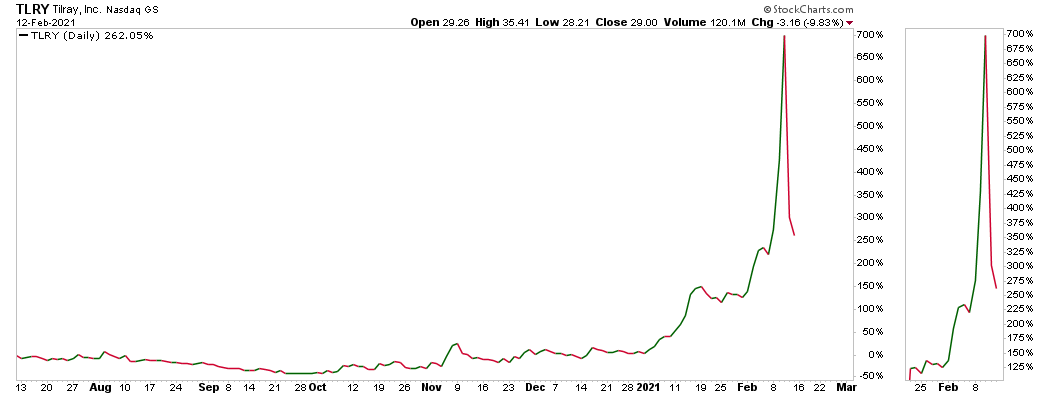
This past week was quite interesting as the “Reddit WallStreetBets” bunch turned their sites away from Gamestop to “Cannabis.” Early in the week, we saw the “mania” re-manifest itself into names like Tilray (NASDAQ:TLRY), Aphria (NASDAQ:APHA), Cronos (NASDAQ:CRON), and others.
However, this time it looks like “Reddit” traders learned their lesson to “get out early” as the trade went “up in smoke” rather quickly.
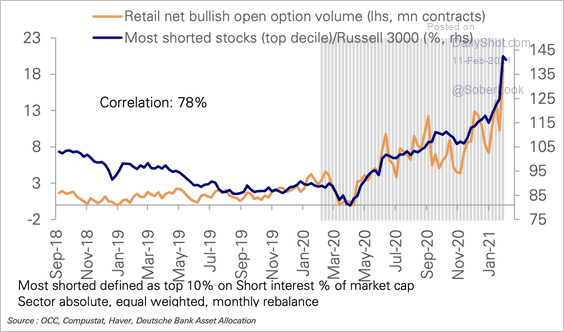
Nonetheless, the “speculative mania” remains in the market overall as speculators continue to operate without “fear” of a correction.
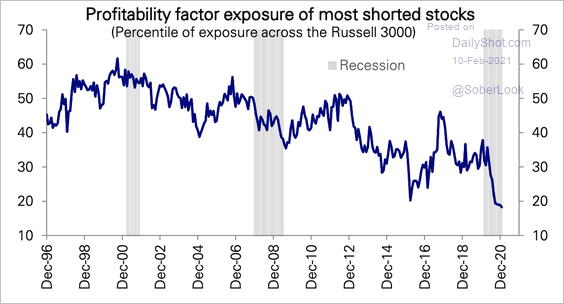
Currently, retail net bullish call options are piling up on the most shorted stocks.
However, those are the stocks with the worst fundamental factors.
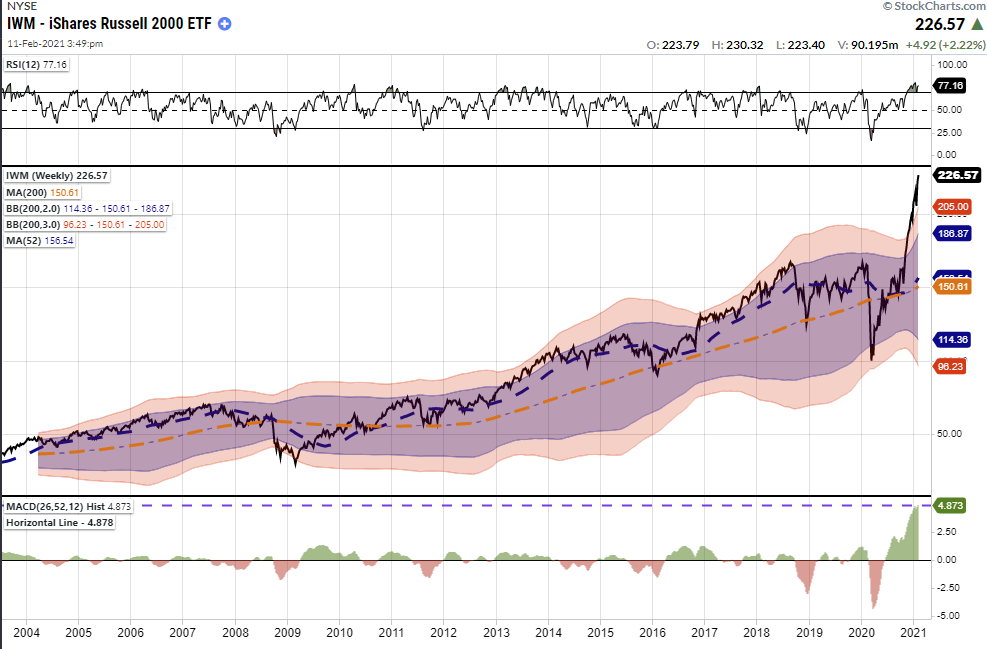
And as investors chase small and mid-cap stocks to record historical deviations from long-term means.
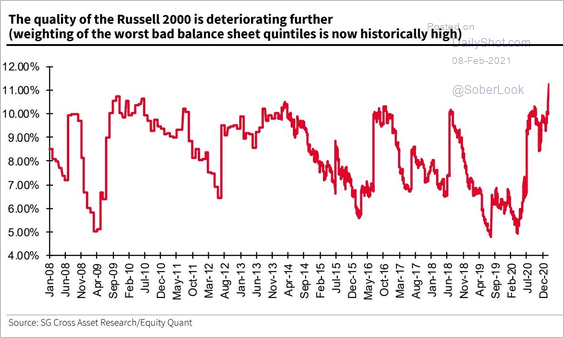
These are also the companies where the quality of fundamentals are deteriorating the most.
But these are just a view of the signs. I did a much more extensive review of the current speculation in “Is This The Biggest Bubble Ever?”
As my colleague Doug Kass noted previously:
“It is growing increasingly clear to me that global stock markets are in the process of making a speculative move (driven by global liquidity) that may even compare to the advances that culminated in the seminal market tops in the Fall of 1987 and in the Spring of 2000.
No longer is the market hostage to the real economy or sales and profit growth – stuff I have spent four decades analyzing. Instead, liquidity is seen as an overriding influence, actually it has become the sine quo non.
As such, historical valuations become increasingly irrelevant, and price momentum is the lodestar.“
He is right.
Two Important Threats
The question of what could wrong is extremely difficult to answer. The reason is that historically, the thing the “goes wrong,” is almost always something no one is talking about. In February 2020, estimates were for a raging bull market, and then the world was shut down by a pandemic.
“Stuff Happens,” and always when we least expect.
There are, however, two threats that could severely limit the market in the months and quarters ahead. Inflation and Interest Rates.
Interest Rates
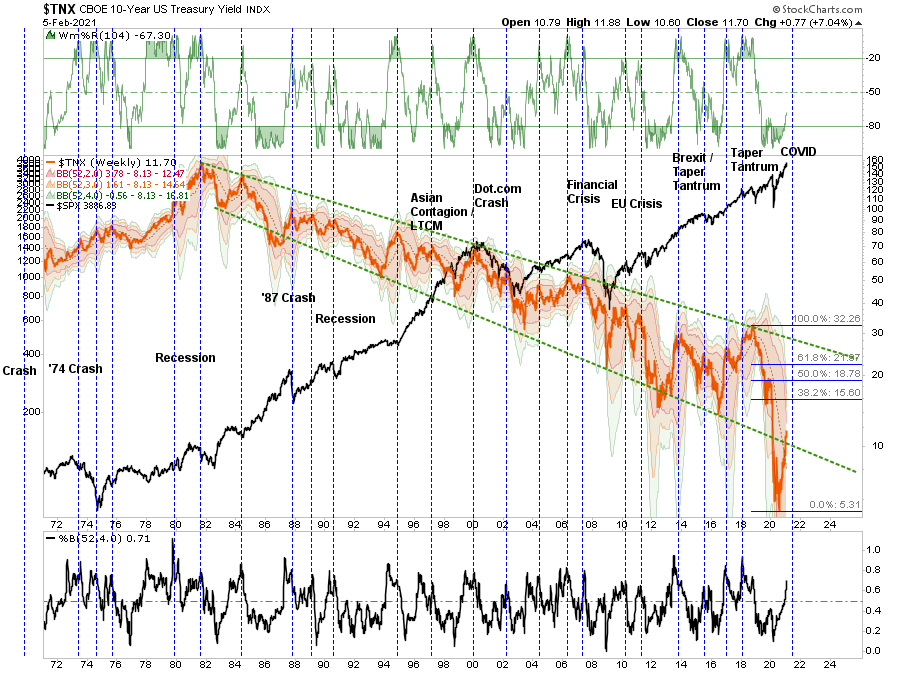
With an economy pushing $85 trillion in debt, the entire premise of the “consumption function,” as well as “valuation justification” for the stock market, is based on low-interest rates. However, that is rapidly ending as the rise in rates is now approaching a “danger zone” for the markets. As noted by SentimenTrader on Thursday:
“The march higher in the yield on 10-year Treasury notes took a breather in recent days, but it’s mostly been a steady rise for most of the last 6 months. So much so that the 1-year z-score, a measure of how unusual the move is relative to recent history, just reached 1.5 standard deviations for the 4th distinct time in the past decade.”
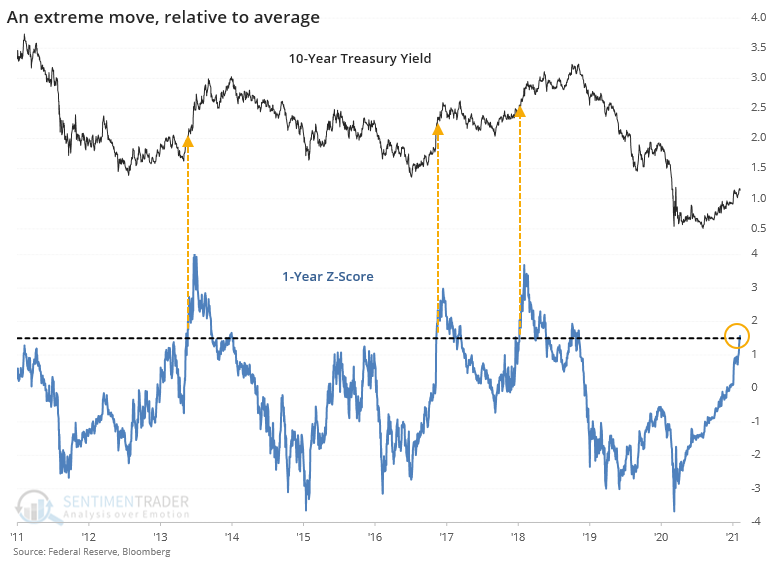
As discussed in “Dollar & Rates Issue A Warning,” interest rates are rapidly approaching the 1.5% to 2.0% barrier, where higher payments will collide with disposable income. Historically, such has not ended well for markets.
Inflation
The second threat is inflation. As noted by Michael Lebowitz:
“In February 2019 we wrote MMT and its Fictional Discipline.
“In 1998, the Bureau of Labor Statistics (BLS) changed the way they calculated real estate prices within CPI. The BLS replaced an index based on actual home prices with what is now called owner’s equivalent rent (OER). OER is a rental equivalence that calculates the price at which an owned house would rent.”
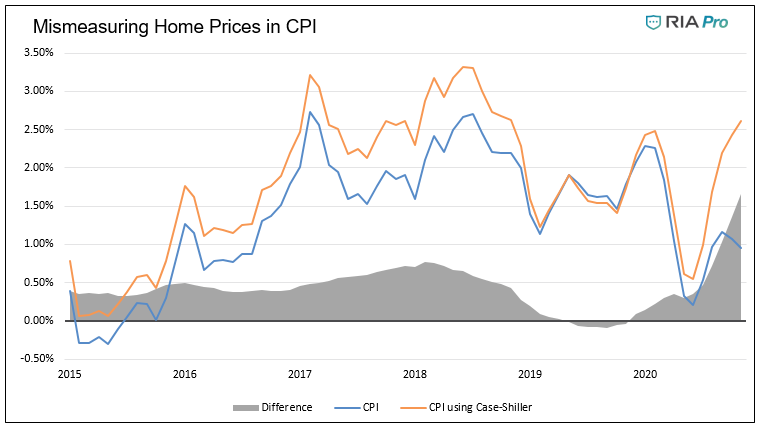
Since 2019, OER has risen 5.12% while the Case-Shiller Home Price Index is up 13.73%. OER comprises nearly a quarter of the CPI calculation. The graph below replaces OER with the CS Index in the CPI calculation to show how inflation is understated due to the sharp divergence between actual home prices and the BLS flawed methodology to compute home prices. Per the graph, CPI would be 2.62% and rising, versus .96% and trending lower. The low CPI reading provides cover for the Fed to keep printing, but at what cost?”
When it comes to the stock market, there is a decades-long correlation between interest rates and inflation. More importantly, as with debt, consumers may handle higher prices or debt payments, but not both.
While investors may be able to justify higher inflation or rates in the short-term, it is unlikely they can justify both. As inflation and rates slow economic growth due to the absorption of disposable income via higher prices and interest payments, the market will begin to reprice risk quickly.
Such could be a problem sooner than many think.
The Reason To Focus On Risk
During the past week, we made no substantive changes to our portfolios. It seems like a good time to review why we chose to “focus on risk” given the seeming “insanity” in the markets currently.
As investors, our job is to navigate the waters within which we currently sail, not the seas we think we will sail in later. Higher returns are generated from the management of “risks” rather than the attempt to create returns by chasing markets. That philosophy got well defined by Robert Rubin, former Secretary of the Treasury when he said;
“As I think back over the years, I have been guided by four principles for decision making. First, the only certainty is that there is no certainty. Second, every decision, as a consequence, is a matter of weighing probabilities. Third, despite uncertainty, we must decide and we must act. And lastly, we need to judge decisions not only on the results, but on how they were made.
Most people are in denial about uncertainty. They assume they’re lucky, and that the unpredictable can be reliably forecast. This keeps business brisk for palm readers, psychics, and stockbrokers, but it’s a terrible way to deal with uncertainty. If there are no absolutes, then all decisions become matters of judging the probability of different outcomes, and the costs and benefits of each. Then, on that basis, you can make a good decision.”
A Simple Philosophy
It should be evident that an honest assessment of uncertainty leads to better decisions, but the benefits of Rubin’s approach, and mine, goes beyond that. For starters, although it may seem contradictory, embracing uncertainty reduces risk while denial increases it. Another benefit of acknowledged uncertainty is it keeps you honest.
“A healthy respect for uncertainty and focus on probability drives you never to be satisfied with your conclusions. It keeps you moving forward to seek out more information, to question conventional thinking and to continually refine your judgments and understanding that difference between certainty and likelihood can make all the difference.”
We must recognize and be responsive to changes in underlying market dynamics if they change for the worse and be aware of the inherent risks in portfolio allocation models. The reality is that we can’t control outcomes. The most we can do is influence the probability of specific outcomes, which is why the day-to-day management of risks and investing based on probabilities rather than possibilities is essential to capital preservation and investment success.
It is just something to consider.

