After the Nov. 9 all-time high of 3646 on the S&P 500 and a, ugly, close at 3550 it has been rather (frustrating?) slim pickings as, eight trading days later, the index is still only at 3660.
So, what is going on? Did the market put in a significant market top or not? Although one can never answer that question with all certainty, I do not think it has. That top will have to wait until around mid-next year in my humble opinion: see my article from Sept 9.
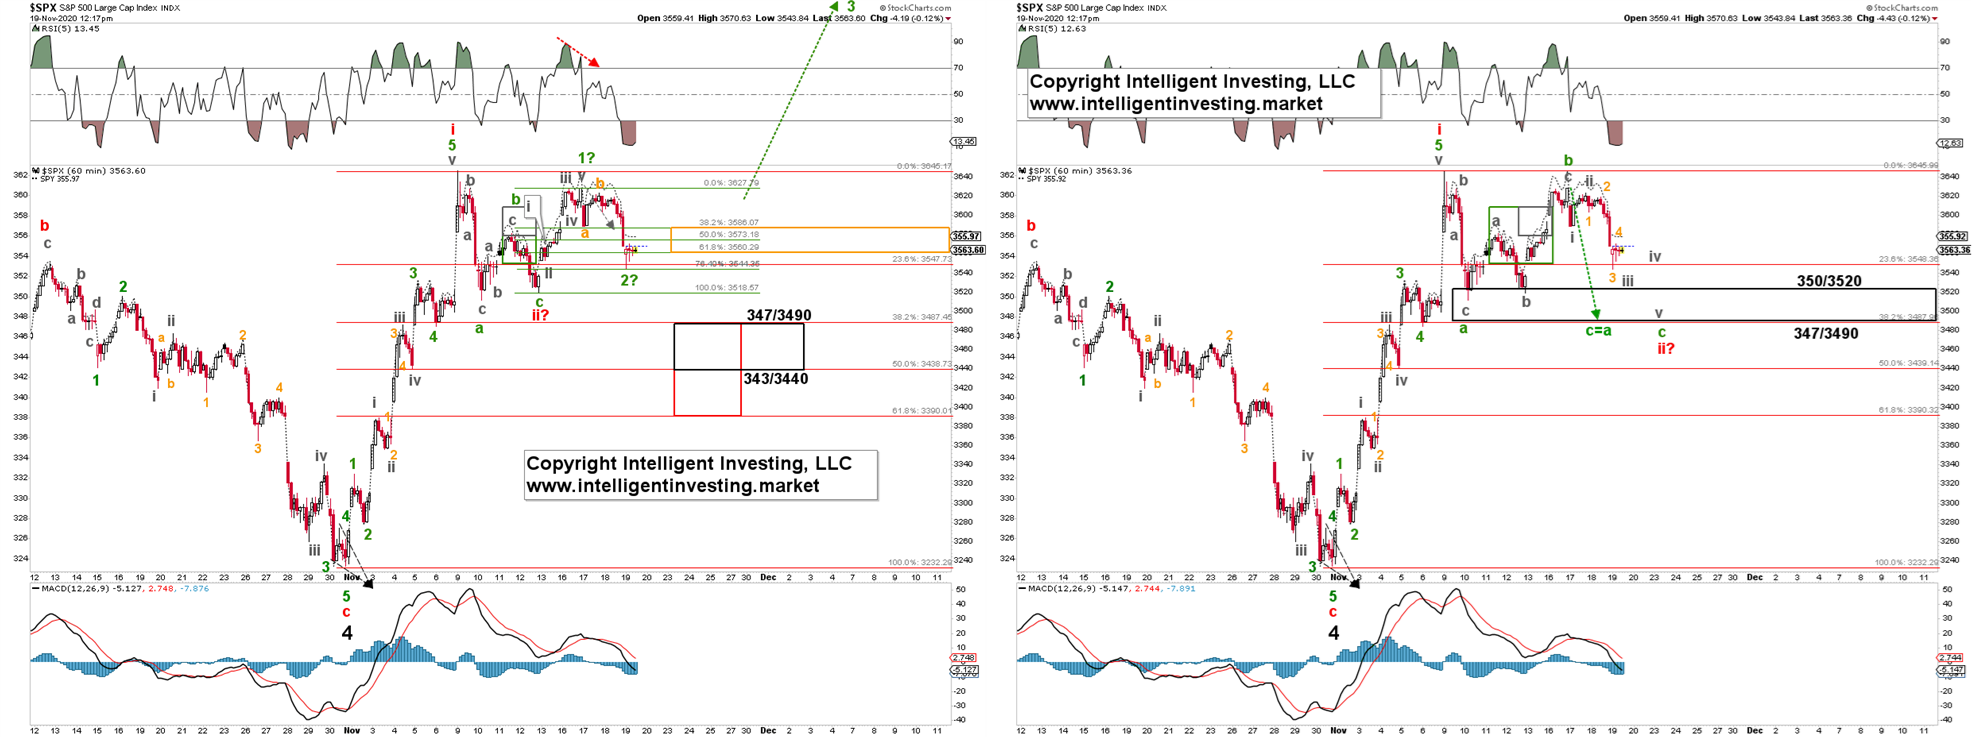
Currently, the market has, in my opinion based on detailed Elliott Wave Principle (EWP) analyses, two options. See Figure 1 below.
Figure 1.

In both options, the index completed a larger 4th wave on Oct. 30, because it rallied from that low in a nice, clean, clear five-wave impulse wave pattern higher (red wave-i) to the Nov. 9 ATH. Since markets trend higher longer term, applying a bullish EWP count to up moves is preferred, though not necessarily correct. But when odds favor a bullish perspective and since the markets are all about the probability of possibilities, I must go with the highest probability option until proven otherwise.
The S&P 500 then started to correct this wave-i of wave-5 rally. Either (red) wave-ii completed already on Nov. 12 at the SPX 3519 low in a simple a, b, c pattern with a truncated c-wave and at today’s low an even smaller (green) 2nd wave completed at the 76.40% retrace of the recent smaller rally (green wave-1). Or the alternative is wave-ii is becoming more complex: it morphed into what is called in EWP terms a flat, see here, with the Nov. 16 high at SPX3629 as complex (green) wave-b, and (green) wave-c to ideally SPX 3520-3490 is now underway and should complete within the next few trading days by wrapping up a few more smaller 4th and 5th waves. Please note the hourly RSI5 is now extremely oversold, it is at 9, and in bull markets that most often means the downside is becoming limited while there is now plenty of upside potential left before the indicators becomes too overbought.
Earlier this week I already showed my premium major markets members in my daily video update, you can watch it here, these two options and the associated downside targets. Even the green wave-2 low I set at SPX3580-3560 is, so far, rather on target. But now I will let the market decide what it will ultimately become: pay me SPX 4000 now or pay me later. Because both the current low and the pending slightly lower low should resolve higher into a 3rd wave: wave-iii of wave-5 targeting SPX 4000+.
A break above SPX 3590 from current levels will tell the 1st option is in play, while a break below SPX 3510 low will tell the 2nd option is operable. Both options I outlined here are ultimately wrong on a break below the late-October lows with a 1st warning below SPX 3390 and a 2nd warning below SPX 3330. Thus, the bulls do have plenty of buffer space, but I have my stops on my long positions set quite a bit higher than such low levels as in trading rule number one is to have “small losses and big gains.” The only way to accomplish that is to manage the downside risk well as the upside will take care of itself.
