Breaking News
Investing Pro 0
💎 Access the Market Tools Trusted by Thousands of Investors Get Started

S&P500: A Look At Short-Term Elliott Wave Count

By Dr. Arnout ter Schure Stock MarketsDec 08, 2020 02:42PM ET
www.investing.com/analysis/sp500-a-look-at-shortterm-elliott-wave-count-200547235
S&P500: A Look At Short-Term Elliott Wave Count
By Dr. Arnout ter Schure   |  Dec 08, 2020 02:42PM ET
Saved. See Saved Items.
This article has already been saved in your Saved Items
 
 
US500
-0.23%
Add to/Remove from Watchlist
Add to Watchlist
Add Position

Position added successfully to:

Please name your holdings portfolio
 
SPY
-0.22%
Add to/Remove from Watchlist
Add to Watchlist
Add Position

Position added successfully to:

Please name your holdings portfolio
 

Over the past several weeks, I kept you informed about how the S&P 500 was setting up. Now, it is most likely on its way to SPX 4000+. Last week it bumped into SPX 3675 resistance four times, red arrows in Figure 1, but managed to break above it on Friday. What once was resistance may now act as support, and the index has retested the SPX 3675 zone three times already this week (green arrows). So far, it is holding, and as long as it does, we can expect SPX 3715+/-5p next.

Why?

That is the simple symmetry breakout target (blue dotted arrows), just like the breakout above SPX 3595 and successful retest thereof lead to the rally to SPX 3645+/-5P (purple dotted arrows).

Figure 1:
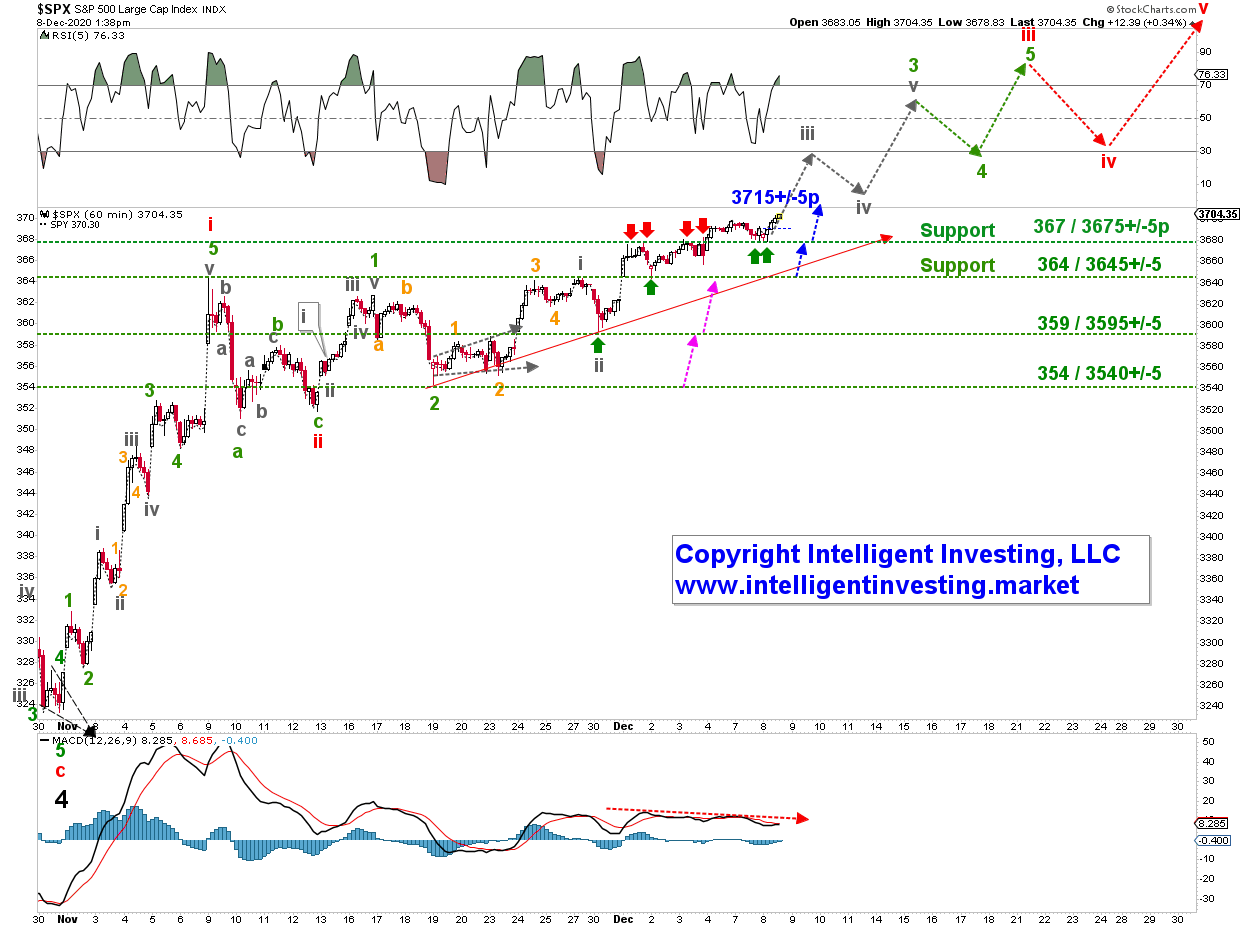
S&P 500 Hourly Candlestick Chart.

This “stair-stepping” behavior is normal bull-market behavior: breakout, retest the breakout successfully, move higher to the next symmetry/Fibonacci-based price-level. Thus, the bears were unable to close the index below SPX 3640 (see last week’s article here) and, therefore, we can now move those “watch-out-below“ levels up by one step to SPX 3675 and SPX 3645. As a trader, one can, for example, move up stops on any index-related long positions accordingly.

Besides, the grey, green and red arrows show the preferred Elliot wave principle (EWP)-based path as we advance (not accurate in price and time). The index bottomed late-October for (black) major wave-4 and is now in major wave-5, which consists of five smaller waves: (Red) intermediate waves i, ii, iii, iv, v. So far, only (red) waves i and ii completed. Intermediate wave-iii is now, ideally and preferably, under way as long as the support levels mentioned above hold.

Since markets are fractal in nature, this red intermediate wave-iii is made up of five smaller waves: (green) minor waves 1, 2, 3, 4, 5. Etc. Based on my internal waves assessments, the index is now in (grey) minute-iii of minor-3 of intermediate-iii of major-5. The grey, green and red dotted arrows show the ideal path going forward to complete major-5, which is the last larger wave up from the March low struck this year. It should end in the spring of 2021 at around SPX 4000-4200. After that, we should see a very sizable correction.

S&P500: A Look At Short-Term Elliott Wave Count
 

Related Articles

S&P500: A Look At Short-Term Elliott Wave Count

Add a Comment

Comment Guidelines

We encourage you to use comments to engage with other users, share your perspective and ask questions of authors and each other. However, in order to maintain the high level of discourse we’ve all come to value and expect, please keep the following criteria in mind:  

  •            Enrich the conversation, don’t trash it.

  •           Stay focused and on track. Only post material that’s relevant to the topic being discussed. 

  •           Be respectful. Even negative opinions can be framed positively and diplomatically. Avoid profanity, slander or personal attacks directed at an author or another user. Racism, sexism and other forms of discrimination will not be tolerated.

  • Use standard writing style. Include punctuation and upper and lower cases. Comments that are written in all caps and contain excessive use of symbols will be removed.
  • NOTE: Spam and/or promotional messages and comments containing links will be removed. Phone numbers, email addresses, links to personal or business websites, Skype/Telegram/WhatsApp etc. addresses (including links to groups) will also be removed; self-promotional material or business-related solicitations or PR (ie, contact me for signals/advice etc.), and/or any other comment that contains personal contact specifcs or advertising will be removed as well. In addition, any of the above-mentioned violations may result in suspension of your account.
  • Doxxing. We do not allow any sharing of private or personal contact or other information about any individual or organization. This will result in immediate suspension of the commentor and his or her account.
  • Don’t monopolize the conversation. We appreciate passion and conviction, but we also strongly believe in giving everyone a chance to air their point of view. Therefore, in addition to civil interaction, we expect commenters to offer their opinions succinctly and thoughtfully, but not so repeatedly that others are annoyed or offended. If we receive complaints about individuals who take over a thread or forum, we reserve the right to ban them from the site, without recourse.
  • Only English comments will be allowed.
  • Any comment you publish, together with your investing.com profile, will be public on investing.com and may be indexed and available through third party search engines, such as Google.

Perpetrators of spam or abuse will be deleted from the site and prohibited from future registration at Investing.com’s discretion.

Write your thoughts here
 
Are you sure you want to delete this chart?
 
Post
Post also to:
 
Replace the attached chart with a new chart ?
1000
Your ability to comment is currently suspended due to negative user reports. Your status will be reviewed by our moderators.
Please wait a minute before you try to comment again.
Thanks for your comment. Please note that all comments are pending until approved by our moderators. It may therefore take some time before it appears on our website.
Comments (5)
Gordan Flego
Gordan Flego Dec 10, 2020 3:57PM ET
Saved. See Saved Items.
This comment has already been saved in your Saved Items
Hello. How do you comment how index performed today. It went lower than target dor wave iv, but second support held. Should we get back to drawing board or this is still in tolerances for wave iv?
Robert Barberesi
Robert Barberesi Dec 08, 2020 9:52PM ET
Saved. See Saved Items.
This comment has already been saved in your Saved Items
I never post on these articles, but I always agree with your analysis (usually because we end up both being right). I have the same dynamic for the SPY going into January with a major top happening in January.
Dr. Arnout ter Schure
Dr. Arnout ter Schure Dec 08, 2020 9:52PM ET
Saved. See Saved Items.
This comment has already been saved in your Saved Items
thank you! I have no way to see your work/analysis, so I will take your word for it ;-)
Ashish Bhura
Ashish Bhura Dec 08, 2020 6:20PM ET
Saved. See Saved Items.
This comment has already been saved in your Saved Items
Nobody know about correction whatever analysis being applied
ECL SALES
ECL SALES Dec 08, 2020 2:51PM ET
Saved. See Saved Items.
This comment has already been saved in your Saved Items
Good analysis Doc.
Dr. Arnout ter Schure
Dr. Arnout ter Schure Dec 08, 2020 2:51PM ET
Saved. See Saved Items.
This comment has already been saved in your Saved Items
thank you.
ECL SALES
ECL SALES Dec 08, 2020 2:50PM ET
Saved. See Saved Items.
This comment has already been saved in your Saved Items
100% higher than the March20 low might be a better target.
ECL SALES
ECL SALES Dec 08, 2020 2:50PM ET
Saved. See Saved Items.
This comment has already been saved in your Saved Items
4400. And in the bubble case 5000 by April21
 
Are you sure you want to delete this chart?
 
Post
 
Replace the attached chart with a new chart ?
1000
Your ability to comment is currently suspended due to negative user reports. Your status will be reviewed by our moderators.
Please wait a minute before you try to comment again.
Add Chart to Comment
Confirm Block

Are you sure you want to block %USER_NAME%?

By doing so, you and %USER_NAME% will not be able to see any of each other's Investing.com's posts.

%USER_NAME% was successfully added to your Block List

Since you’ve just unblocked this person, you must wait 48 hours before renewing the block.

Report this comment

I feel that this comment is:

Comment flagged

Thank You!

Your report has been sent to our moderators for review
Continue with Google
or
Sign up with Email