Get 40% Off
These stocks are up over 10% post earnings. Did you spot the buying opportunity? Our AI did.Read how

S&P 500: What Can Stop The Rally To 4000?

Published 12/03/2020, 03:25 PM
Updated 07/09/2023, 06:31 AM

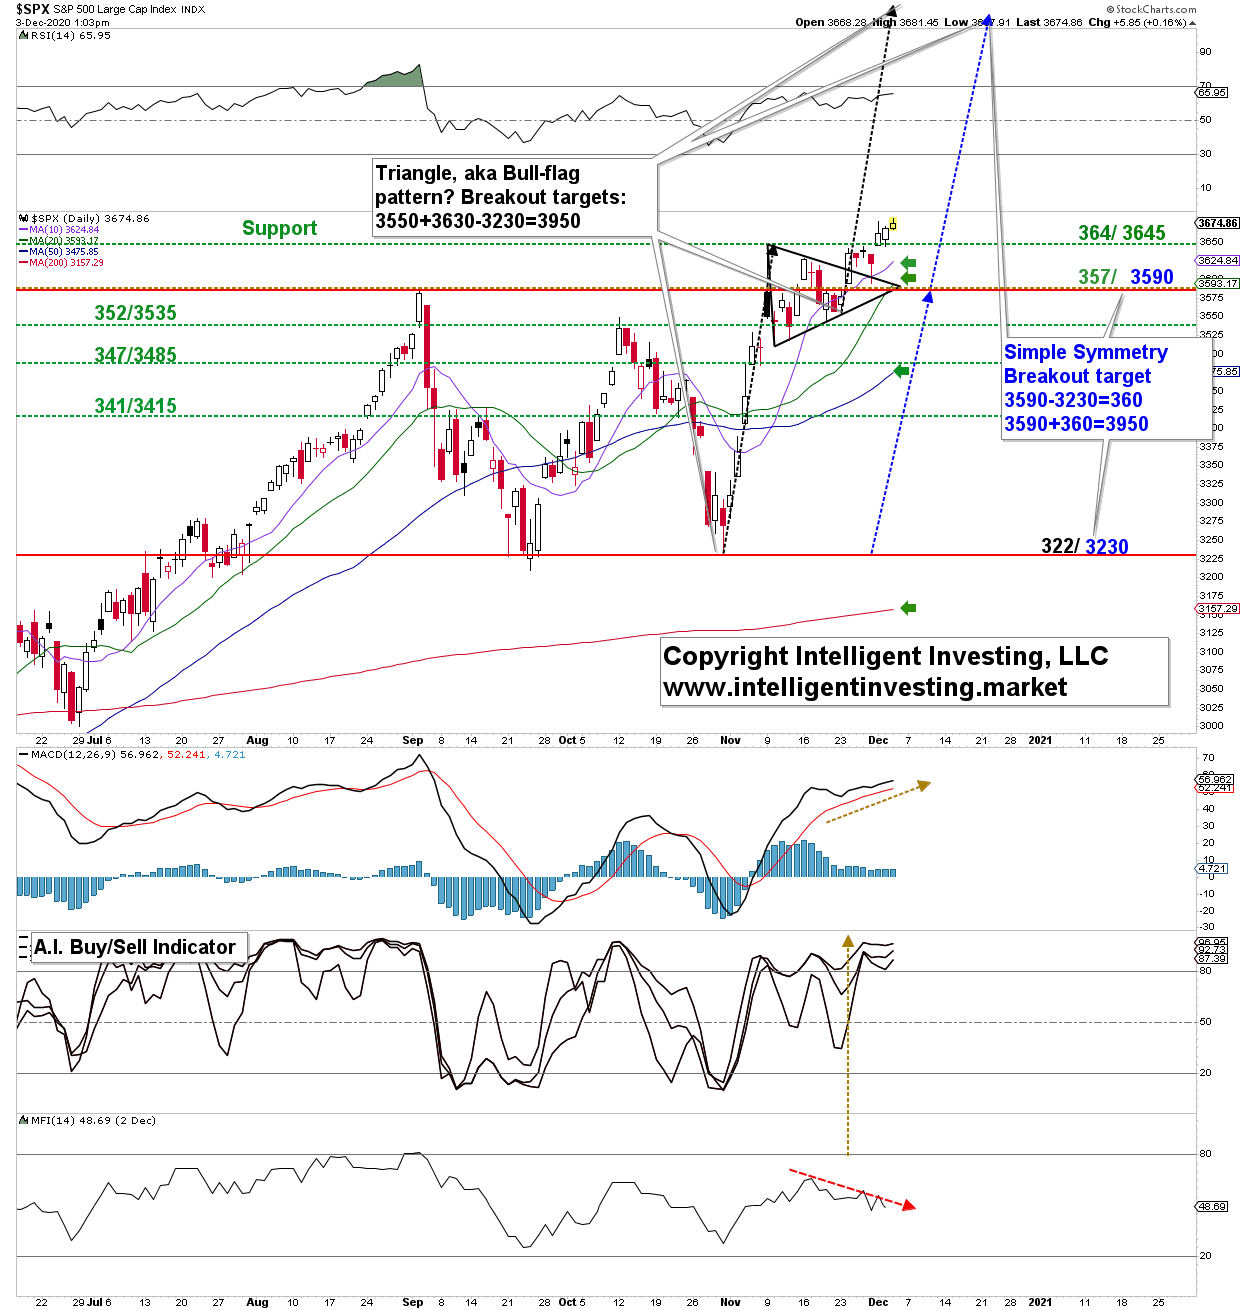
Over the past several weeks, I have kept you abreast of how the S&P 500 was setting up for a rally to SPX 4000. Last week, it broke out from SPX 3590 +/-5p resistance, and now it is has added another 35p to its tally. That is only 0.1%, but up is up: see Figure 1.

From a technical analysis point of view, on Monday, the index back-tested A) the triangle pattern breakout; B) horizontal support; and C) the 10-day Simple Moving Average (SMA): it dropped to as low as SPX 3594 and then rallied.

On Tuesday, it then gapped above final resistance at SPX 3645, which then turned into support. Yesterday it then backtested the SPX 3645 support level successfully. And today it made, once again, and so far- a higher high and higher low. All of this is still normal and technically sound market behavior.

Figure 1:
SPX Chart.

Besides, the index is above its rising 10d, 20d, 50d, and 200d SMA (small green arrows), which in turn are bullishly stacked, meaning the 10d>20d>50d>200d. Thus, the index is in short- to long-term uptrends. When price and the SMAs are aligned like this, any instrument is then in a 100% bullish market. As such, one must wear a bullish hat until that changes. So, what needs to change for the index to turn bearish?

  1. Close back below SPX 3645
  2. Close back below SPX 3590

That will turn the trend short-term down as then the index is trading below its 10d and 20d SMA. But even then, the intermediate- and long-term trends are still intact, and the next levels to watch are SPX 3485 (where the 50d SMA now is at) and SPX 3415. If this last level goes, then there is a big air pocket down to the 200d SMA. For now, I prefer to see the SPX3590 level to hold from current levels, and on any pullback, to keep the bullish trend to SPX4000+ intact.

3rd party Ad. Not an offer or recommendation by Investing.com. See disclosure here or remove ads .

Thus, from a relatively simple technical analysis perspective, the bulls have many buffers before this market turns on them. As a trader, one can use these price levels as stops to either minimize losses or protect profits depending on entry-level and trading timeframe. That is the only sound way to go about when approaching the markets. Hope is not a strategy.

Latest comments

excellent, thank you
thank you!
I like the last sentence. So true.
thank you!
Nothing. Nothing can stop it. The fed is king.
a crash this is mad overbougjt if u want a bubble & a repeat of 2007 they need to buy more
Risk Disclosure: Trading in financial instruments and/or cryptocurrencies involves high risks including the risk of losing some, or all, of your investment amount, and may not be suitable for all investors. Prices of cryptocurrencies are extremely volatile and may be affected by external factors such as financial, regulatory or political events. Trading on margin increases the financial risks.
Before deciding to trade in financial instrument or cryptocurrencies you should be fully informed of the risks and costs associated with trading the financial markets, carefully consider your investment objectives, level of experience, and risk appetite, and seek professional advice where needed.
Fusion Media would like to remind you that the data contained in this website is not necessarily real-time nor accurate. The data and prices on the website are not necessarily provided by any market or exchange, but may be provided by market makers, and so prices may not be accurate and may differ from the actual price at any given market, meaning prices are indicative and not appropriate for trading purposes. Fusion Media and any provider of the data contained in this website will not accept liability for any loss or damage as a result of your trading, or your reliance on the information contained within this website.
It is prohibited to use, store, reproduce, display, modify, transmit or distribute the data contained in this website without the explicit prior written permission of Fusion Media and/or the data provider. All intellectual property rights are reserved by the providers and/or the exchange providing the data contained in this website.
Fusion Media may be compensated by the advertisers that appear on the website, based on your interaction with the advertisements or advertisers.
© 2007-2024 - Fusion Media Limited. All Rights Reserved.