We find it hard to describe the past twelve months. What a year it’s been. A little over a year ago, the world was in utter panic. No-one really knew what is going on nor what was going to happen next. The prevalent emotion across the globe was fear. In the financial markets that fear manifested itself in the form of a panicked selloff – the fastest bear market on record. Stock markets were in free fall worldwide and U.S. indices were no exception. The S&P 500 plunged 35% in just a month.
Fortunately, with the help of Elliott Wave analysis we managed to warn our subscribers about it while the index was still hovering around 3340 in February. By Mar. 23, it was already down to 2192.
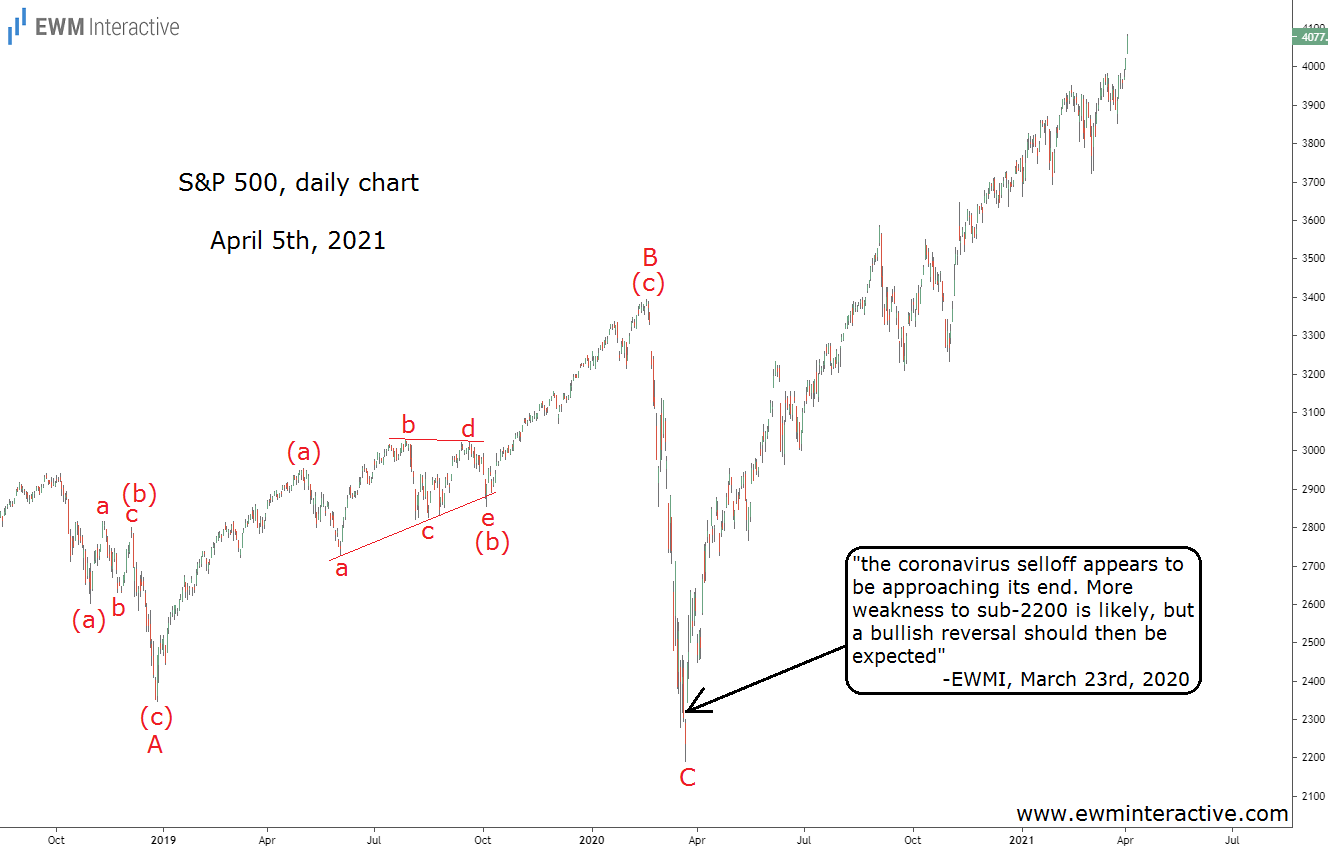
The COVID-19 situation was going from bad to worse very quickly. Countries on every continent were closing their borders to curb the spread of the virus and entire economies had to be put on hold until further notice. Then, all of a sudden, a sharp bullish reversal occurred. And we are happy to say we were able to predict that too. Take a look.

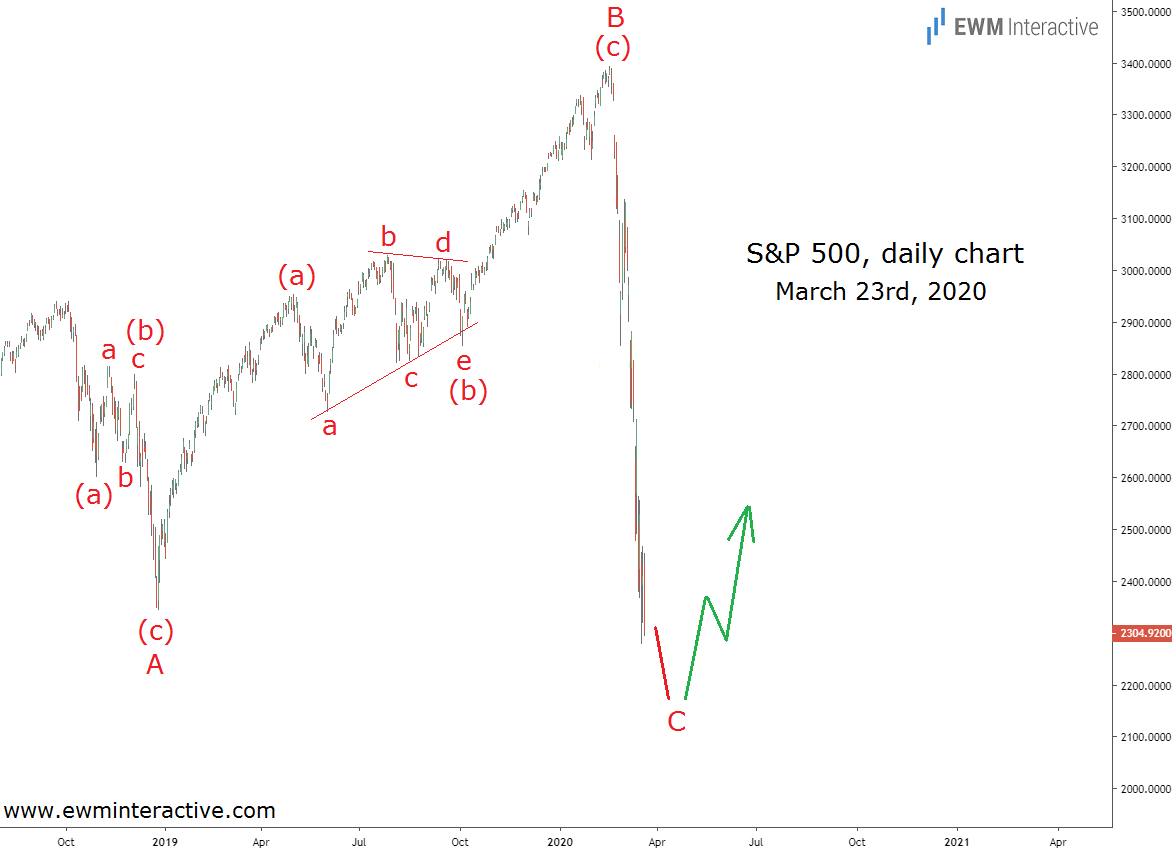
Mar. 23, 2020, was a Monday and prior to every Monday’s market open we send our premium analyses to subscribers. The chart above was included in the S&P 500 analysis our clients received late-Sunday, Mar. 22, 2020.
As visible, we thought an expanding flat correction has been in progress since October 2018. This is a corrective pattern, labeled A-B-C, where waves A and B consist of three sub-waves, wave B makes a new high and wave C is an impulse to a new low.
Looking for Elliott Wave Patterns in the S&P 500 Instead of Into the Abyss
Despite the panic that was sweeping the world at the time, the daily chart of the S&P 500 depicted an almost complete expanding flat correction. According to the Elliott Wave theory, once a correction is over the preceding trend resumes. Hence, instead of extrapolating the selloff into the future, we thought a bullish reversal can soon be expected.
In other words, while the virus was just starting to inflict real damage upon the world, Elliott Wave analysis was already preparing us for the post-COVID recovery. Paradoxically or not, in the midst of the biggest crisis since the Great Depression, the following twelve months have been phenomenal for stock market investors.

The S&P 500 touched 4083 yesterday, up 86% from that March 2020 bottom. The huge amount of fiscal and monetary stimulus accompanied by the vaccines roll-out certainly contributed to the rally. With the end of the pandemic now in sight, many fear the markets might actually be in bubble territory. We agree.
As always, where exactly the top is going to form is impossible to predict. Given its success at putting us ahead of the past two major turns, however, we have confidence in the Wave principle’s ability to warn us about it early enough.
