
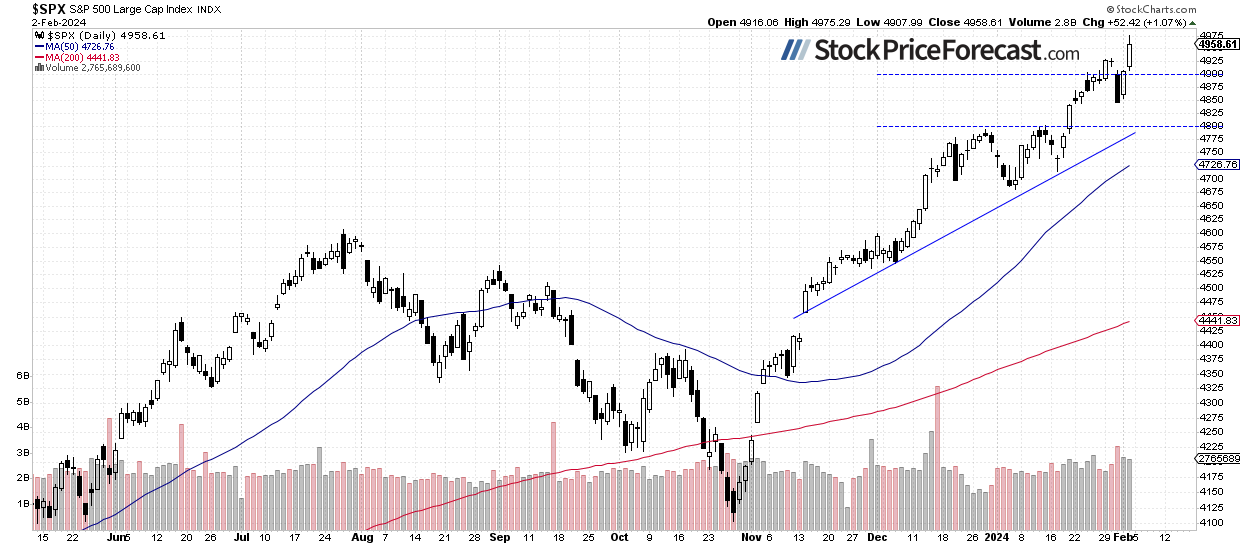
On Friday, bulls were in charge once again as stock prices set new record highs following top tech earnings releases and economic data. The S&P 500 reached a new all-time high at the level of 4,975.29, nearing the psychologically important 5,000 mark. My short-term outlook was still neutral because the market seemed overbought and ready for a downward correction. When in doubt, it’s better to stay out of a position than to try to catch a top and open a short position too early.
The stock market should open slightly lower today, with the S&P 500 futures contract trading 0.3% below its Friday’s closing price. Although some downward correction is widely expected, the market picture remains bullish, and the index may get another chance to reach the 5,000 level.
Last week, upward momentum was fueled by earnings releases and expectations of a more accommodative monetary policy from the Federal Reserve. However, on Wednesday, the Fed's pivot in monetary policy became less obvious, leading to a sell-off in stocks. Stock prices reacted negatively to the release of the Fed's monetary policy and Jerome Powell's press conference. The S&P 500 index sold off to a local low of around 4,845. However, on Thursday and Friday, strong earnings releases and positive monthly jobs data drove prices back up to new records.
Investor sentiment significantly improved last week; Wednesday’s AAII Investor Sentiment Survey showed that 49.1% of individual investors are bullish. The AAII sentiment is a contrary indicator in the sense that highly bullish readings may suggest excessive complacency and a lack of fear in the market. Conversely, bearish readings are favorable for market upturns.
On Tuesday, I wrote that “Despite new highs, it seems that a correction scenario is likely in the near term. (…) caution may be advised, as a correction or consolidation could occur at some point.” The prediction proved correct until Thursday when the market began rallying again. However, today, the same statement remains very true, as the market still appears overbought in the short term.
The S&P 500 is expected to slightly retrace some of its Friday rally this morning. On Friday, the market pulled back in the final hour of trading, and today, it may extend a short-term downward correction. The market is at its highest point in history, as we can see on the daily chart.
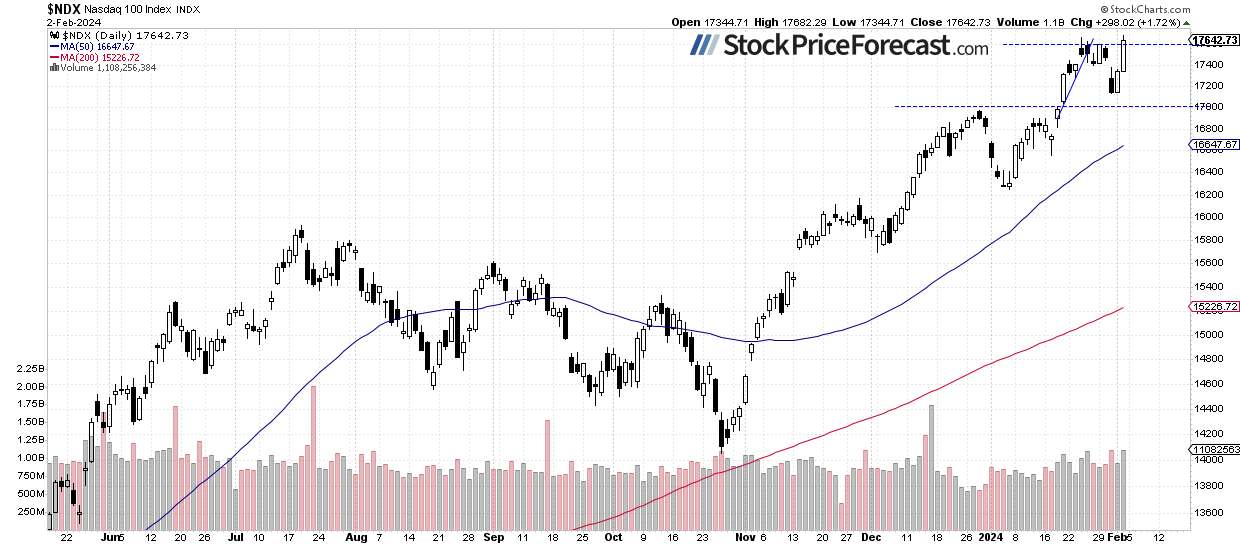
Nasdaq Reached New Record, but…
On Friday, the technology-focused Nasdaq 100 index reached a new all-time high at the level of 17,682.29, only slightly surpassing its January 24 high of around 17,665. It remains relatively weaker than the broad stock market, despite a 20% record-breaking daily rally in Meta Platforms (NASDAQ:META) stock. There is some weakness underneath, and not all tech stocks are breaking records. Overall, in the case of Nasdaq, it looks more like consolidation than an uptrend.
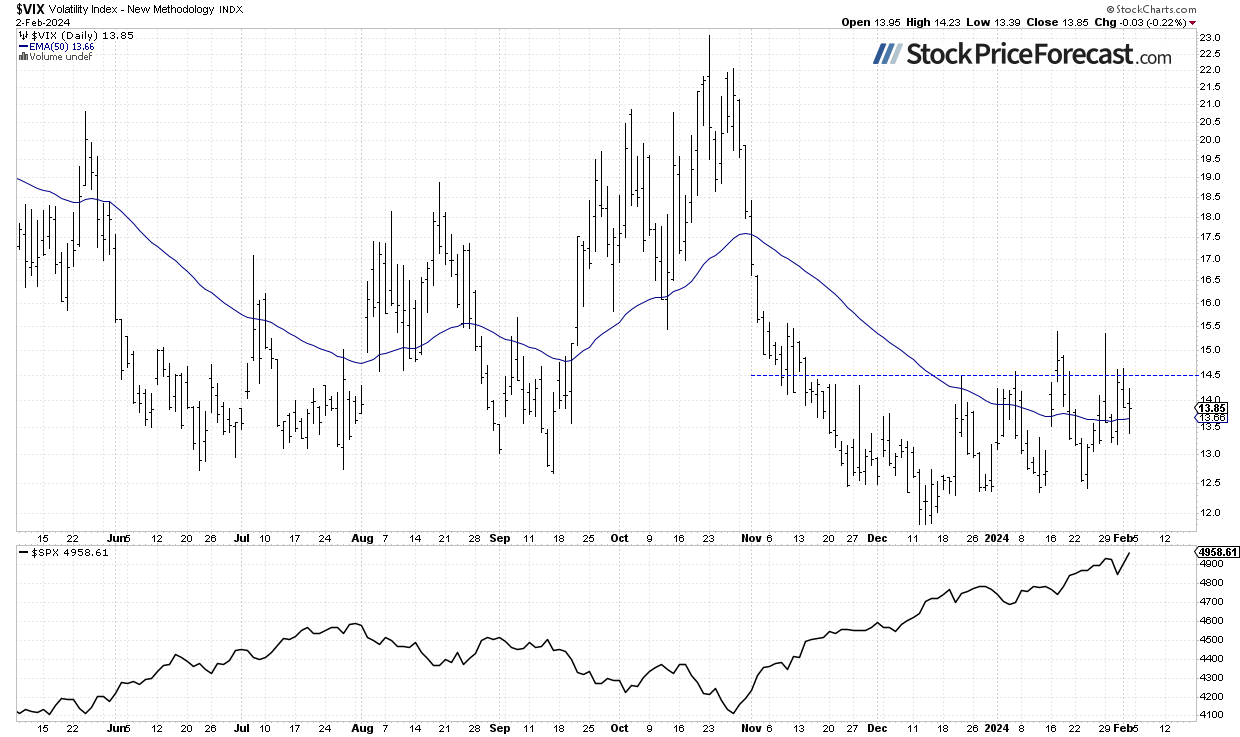
VIX Is Stable, Remains Below 15
The VIX index, also known as the fear gauge, is derived from option prices. While it continues to trade sideways, there have been attempts at a breakout above the 15 level. Last Wednesday's stock market rout pushed the VIX above the 14 level, and on Friday, it was closer to 13.
Historically, a dropping VIX indicates less fear in the market, and rising VIX accompanies stock market downturns. However, the lower the VIX, the higher the probability of the market’s downward reversal.
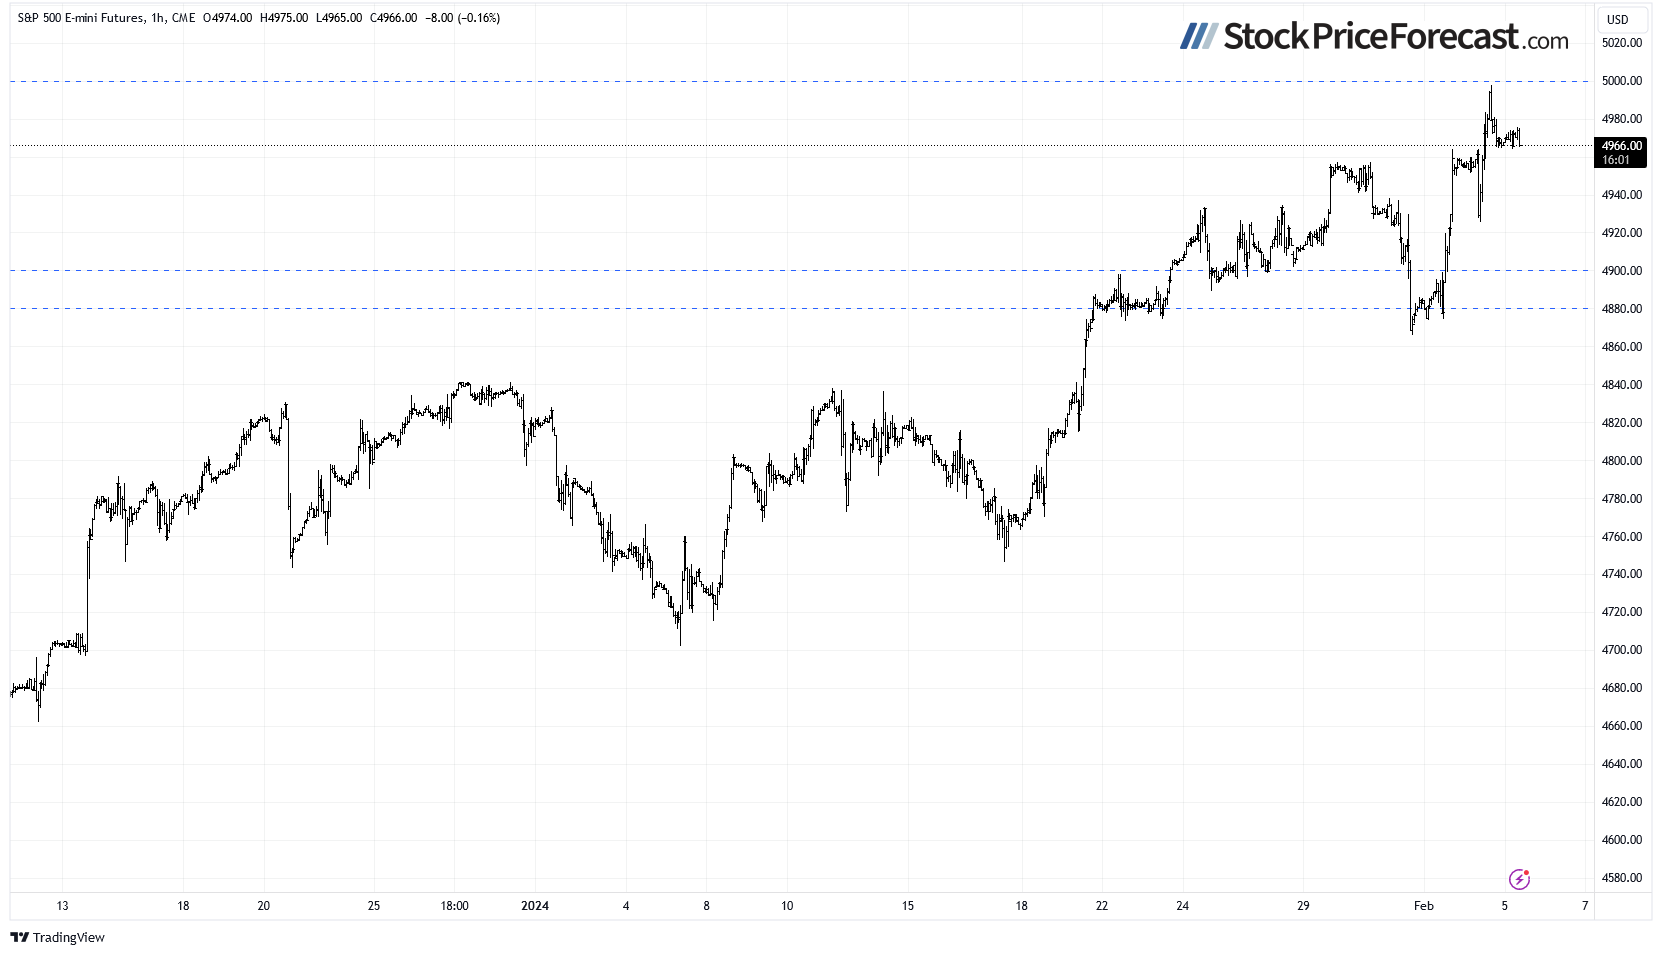
Futures Contract Retreats from 5,000
Let’s take a look at the hourly chart of the S&P 500 futures contract. On Friday, it was very close to the 5,000 level, and this morning, it’s trading below 4,970. The nearest important support level is at 4,940-4,950, and the crucial one is at 4,880-4,900, marked by the recent lows.
Conclusion
Friday’s record-breaking rally once again proved that the trend is still bullish. However, in the short term, a downward correction or consolidation cannot be ruled out. Just one look at the chart, and one can see that the S&P 500 index has become more volatile as of late. This morning, it is expected to open 0.3% lower, following Friday gain of 1.07%. Profit-taking action is likely; however, for now, it looks like another consolidation within an uptrend.
On December 21, I mentioned that “in a short-term the market may see some more uncertainty and volatility”, and indeed, there was a lot of uncertainty following the early-December rally and the breakout of the S&P 500 above the 4,700 level. However, the previous week’s price action left no illusions of a potential medium-term trend reversal. On Tuesday, I noted that “The market is overbought in the short term, but predicting a correction is currently very challenging.”, and it is still proving correct; the Wednesday’s rout was very short-lived and on Thursday and Friday, bulls came back with a vengeance.
For now, my short-term outlook remains neutral.
Here’s the breakdown:
- The S&P 500 is set to retrace more of its Friday’s record-breaking rally this morning.
- For now, it seems to be a short-term consolidation within an uptrend.
- In my opinion, the short-term outlook is neutral.