
AT40 = 60.5% of stocks are trading above their respective 40-day moving averages (DMAs)
AT200 = 58.2% of stocks are trading above their respective 200DMAs
VIX = 12.0
Short-term Trading Call: neutral
Commentary
Last week the stock market made history by delivering the longest bull market in history.
The flex reaction is to say this is a time to sell. Despite the title of the CNBC Fast Money piece below, Professor Robert Shiller cautioned against jumping to that conclusion even though the market does look over-extended in his eyes (as he has said for several years now). As is his form, Shiller danced around some projections and then underlined his disclaimer “I could be wrong.”
What I see in the charts is encouraging for the short-term although my intuition is struggling to accept it. The S&P 500 (SPY (NYSE:SPY)) made its first closing all-time high in over 7 months. The NASDAQ joined in with its own fresh all-time high. The Invesco QQQ Trust (QQQ) is right behind the pack. The iShares Russell 2000 ETF (IWM) broke out to its own new all-time on Tuesday of last week and definitively ended two months of churn.
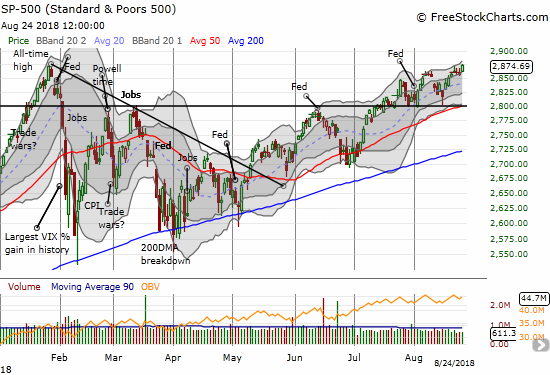
It took 7 months, but the S&P 500 (SPY) FINALLY closed at a new (marginal) all-time high.
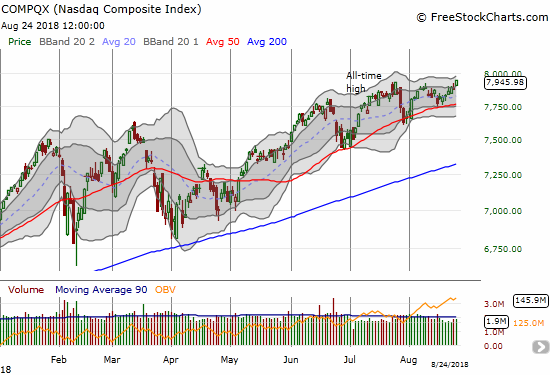
The NASDAQ Composite has mainly had up days over the past month leading to its latest all-time high.
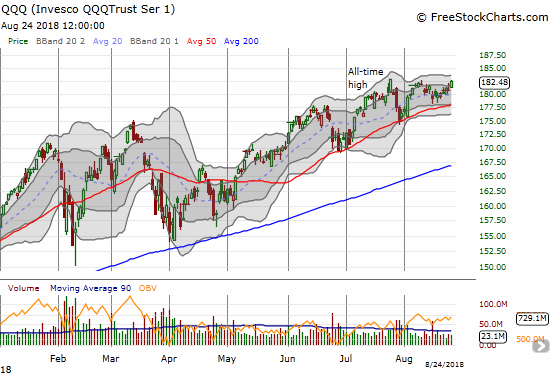
The Invesco QQQ Trust Series 1 (NASDAQ:QQQ) lagged the party a bit, but it is just a hair away from its next round of all-time highs.
The iShares Russell 2000 (NYSE:IWM) printed a major breakout last week to its latest all-time highs.
Even retailers have joined the party. While Friday was a down day, the SPDR S&P Retail ETF (NYSE:XRT) burst to new all-time highs last week. With XRT up a healthy 14.9% year-to-date versus the S&P 500’s 7.5% gain and the NASDAQ’s 15.1% gain year-to-date, 2018 is looking like the year of retail I predicted last year after XRT previously peaked in 2015. I greatly tempered my expectations when XRT broke its February low in March. The ironies are not lost on me, and I am duly noting follow-through on conviction as an area of improvement! (Granted part of my issue is that I was not studying the fundamentals of retail nearly as deeply as I do, say, the home builders).
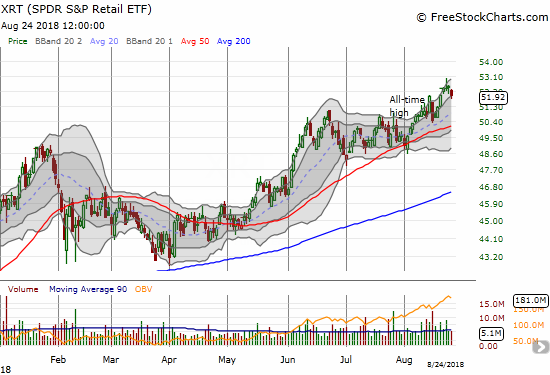
The SPDR S&P Retail ETF (XRT) broke out in impressive form this month.
The volatility index cooperated with the bullish mood by falling back to 12.
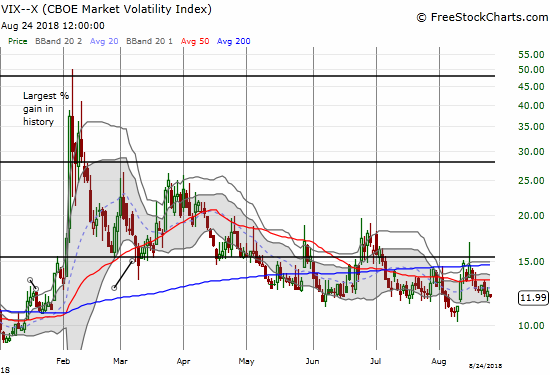
The volatility faders are keeping a tight lid on the volatility index. The VIX is right back to 12 now.
AT40 (T2108), the percentage of stocks trading above their respective 40-day moving averages (DMAs), is the one sticking point in this otherwise bullish story (surprise, surprise). My favorite technical indicator looked great on Tuesday when it burst upward to 61.9% and a 2-week high. Unfortunately, it stalled after that and failed to confirm the subsequent all-time high for the S&P 500. AT40’s stalling means that I will stay wary: adding to SPY puts expiring after Labor Day and sticking with the rotation on options betting on the next spike in the VIX. My short-term trading call stays at neutral as I still have no conviction either way. If buyers stay active, AT40 SHOULD push itself close to or into overbought territory by the end of this week. A failure to do so may raise the specter of another bearish divergence.
CHART REVIEWS
Boeing (NYSE:BA)
This is a market of perfect technical support. BA pulled off a picture-perfect bounce off 200DMA support on August 15th, and I am glad I put aside my inclination to fade BA rallies to get long with call options. I sold the call options once BA hit 50DMA resistance.
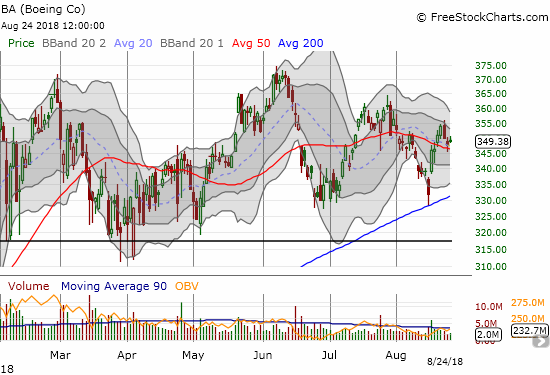
Boeing (BA) tested 200DMA support for the first time in almost two years and survived in picture-perfect form.
Best Buy Co Inc (NYSE:BBY)
BBY is helping lead the charge for retailers. Last week the stock experienced a major breakout to new all-time highs. Earnings on the morning of August 28th will be a major test of the retail story.
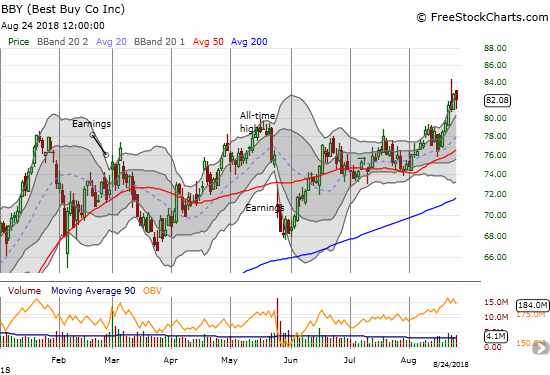
Best Buy (BBY) made an important breakout to all-time highs last week.
Baidu Inc (NASDAQ:BIDU)
BIDU printed a hammer bottom on August 15th and buyers quickly confirmed the pattern. The market’s vicious post-earnings fade of Alibaba (NYSE:BABA) convinced me to take the small profits on my shares. I am still holding my call spread with an expiration out in October.
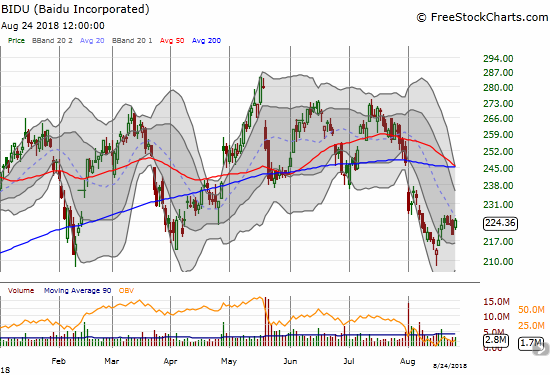
Baidu (BIDU) is fighting to print the rare triple bottom. Its 50 and 200DMA resistance loom menacingly overhead as resistance in waiting.
Caterpillar (NYSE:CAT)
I am back to using CAT as a full hedge on bullishness. While August 15th delivered a relatively convincing bottoming pattern (a kind of hammer), CAT’s 50DMA was equally up to the task of resistance last week.
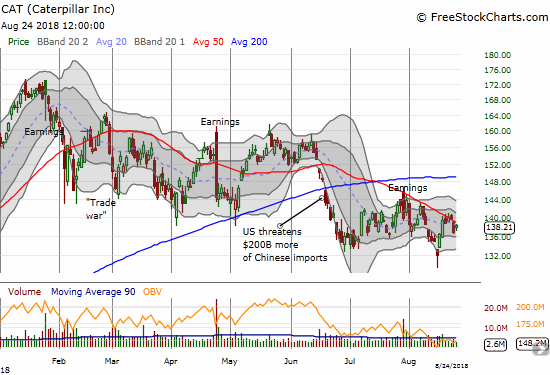
Caterpillar (CAT) is still struggling with cascading weakness from a major post-earnings fade.
Cisco (NASDAQ:CSCO)
I have not looked at CSCO in a LONG time. The company is no longer sexy compared to the other hot growth companies in tech, especially given it remains far off its dotcom heights. Still, with a 3% dividend yield, a post-earnings breakout, and a 14 forward P/E, CSCO looks like the next tech company I want to stuff away in my portfolio. The Amazon (NASDAQ:AMZN) Panic trade paid its own (typical) dividends as buyers quickly took CSCO back to 50DMA resistance. It took a picture-perfect 200DMA bounce to firm up CSCO’s bottom and launch into earnings.
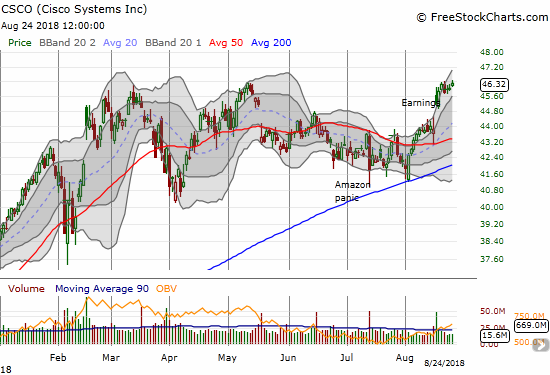
Cisco (CSCO) is on the edge of a major breakout thanks to post-earnings momentum.
Dick’s Sporting Goods Inc (NYSE:DKS)
DKS is one of the remaining retailer trades I have continued.
DKS failed to re-establish upward momentum after its latest earnings report. At least it held 50DMA support. I continue to stick with my strategy of buying shares married to covered calls with post-earnings expirations. With a 2.4% dividend yield as a sweetener, I have enjoyed what so far seems like low risk (albeit not exciting) profits.
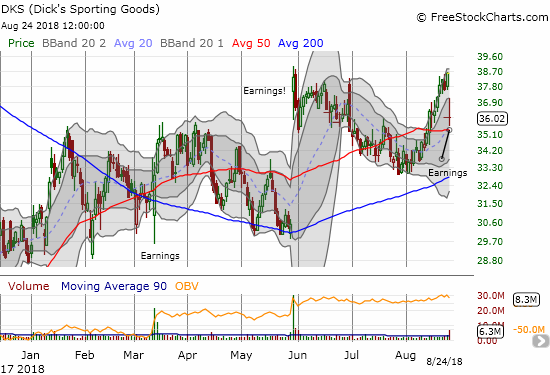
Dick’s Sporting Goods (DKS) has done a lot of churning in 2018 on its way to a 20% year-to-date gain.
Facebook (NASDAQ:FB)
When FB managed to break out above 200DMA resistance, I thought the move signaled the end of the short trade. I rushed back in after it soon broke down. I covered last week after sellers seemed to lose steam. Moreover, I suspect that new highs on the NASDAQ will have the “catch-up” buyers looking for “cheap” shares, and FB looks like a prime candidate.
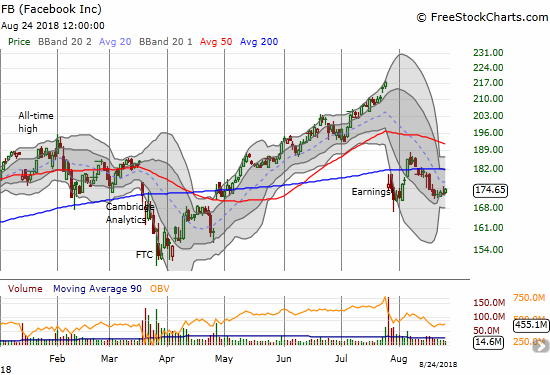
Facebook (FB) lost its post-earnings bounce but held its post-earnings lows. The stage is set for extended churn with 50 and 200DMA resistance levels looming above.
General Electric (NYSE:GE)
GE still has not bottomed much less broken its persistent downtrend. Yet, I am sticking by the longer-term trade.
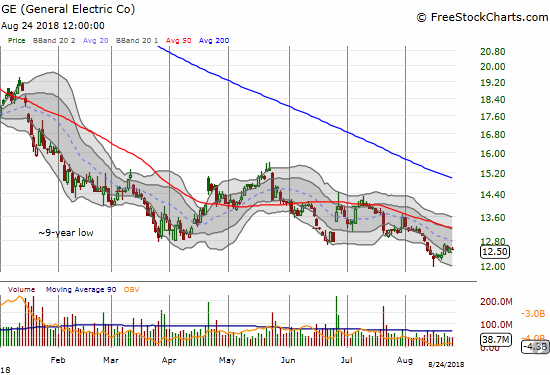
General Electric (GE) printed a bottoming hammer on August 15th like so many other stocks. But are buyers in GE interested enough in holding this support level?
Hibbett Sports Inc (NASDAQ:HIBB)
HIBB disappointed the market to the tune of a 30.2% post-earnings drubbing. While this loss was enough for a new 2018 closing low and a 50/200DMA breakdown, the collapse stands in stark contrast to the accelerated expectations that caused the stock to ramp to a 1 1/2 year high ahead of earnings. With 43.5% of the float sold short, this stock will likely continue to be subject to large moves up and down until the company’s story becomes clear one way or the other.
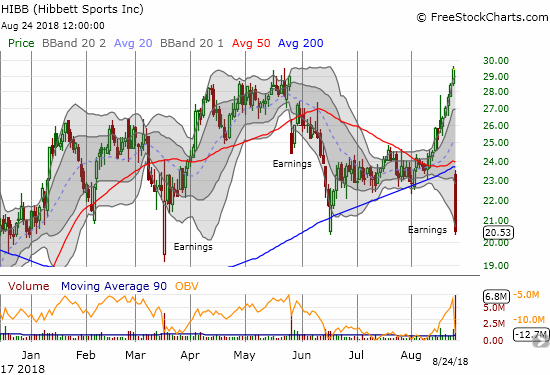
In one post-earnings sell-off, Hibbett Sports (HIBB) fell from a 1 1/2 year high to a new 2018 closing low.
Macy’s Inc (NYSE:M)
I made the argument that the sell-off in Macy’s was overdone. The stock delivered a picture-perfect rush back to 50DMA resistance. I sold my call options there. The renewed selling pressure has my radar up for the next buying opportunity.
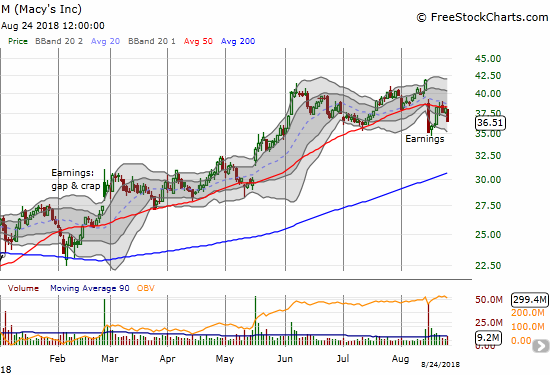
Macy’s (M) bounced back to 50DMA resistance, but buyers are not yet convinced of the post-earnings opportunity.
Match Group Inc (NASDAQ:MTCH)
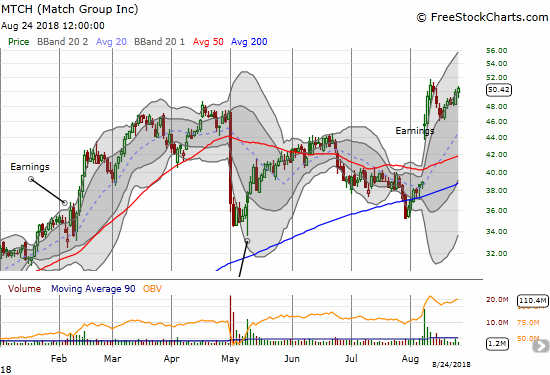
49.0% of MTCH’s float is sold short. Clearly a LOT of skepticism exists out there about the viability of online dating. MTCH’s last earnings report helped propel the stock to a major breakout and a series of fresh all-time highs. The pullback to the bottom of the upper-Bollinger Band (BB) channel was a great swing trade entry point that I missed. This stock looks strong enough to buy the next breakout, so I am on alert.
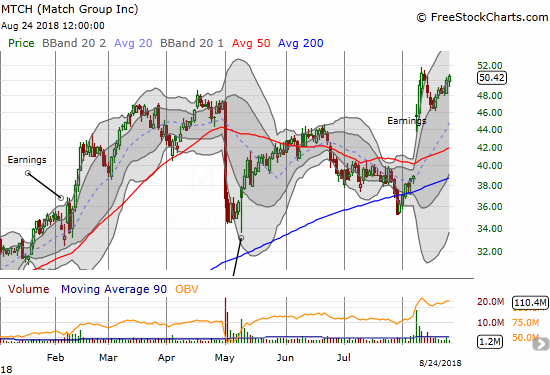
Match.com (MTCH) is making a bid for a major new breakout.
Netflix (NASDAQ:NFLX)
I have argued for a top in NFLX since it gapped down from its last all-time high in June. That call paid well until analysts covered the stock last week in major upgrades. I was too slow in recognizing the bottom as I started with a very conservative calendar call spread on Monday. NFLX quickly blew through my strike, so on Friday I switched to a call spread with a put spread as a hedge. Incredibly, NFLX blew right past the top of the call spread for good measure. I am trying not to think of all the profits left on the table from making this trade off the bottom overly complicated. NFLX gained 13.3% on the week.
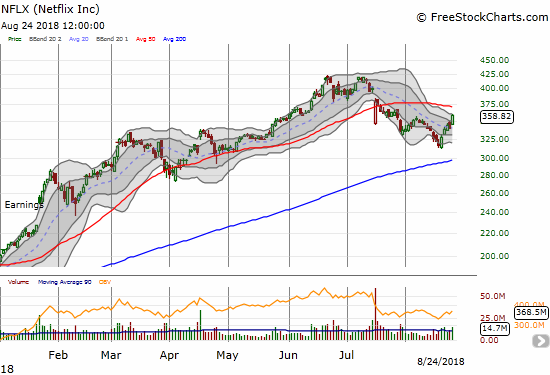
The top in Netflix( NFLX) may still be in, but a tradable bottom is likely also in place. This back and forth sets up a newly downtrending 50DMA as a major test of resistance.
iPath Bloomberg Cocoa Subindex Total Return Exp 24 June 2038 (NYSE:NIB)
Troubles in the financial sector in the Ivory Coast are threatening the country’s ability to export cocoa. I believe this latest drama for the West African country and cocoa’s largest producer are helping to propel the price of cocoa off recent lows. This surprise rally caught me just one tranche short of rebuilding my long position in NIB. I was tempted to take profits on Friday with NIB at 200DMA resistance, but I decided to wait for at least one more day to see whether momentum can propel NIB to a gap up higher. I think I have enough cushion to salvage profits if NIB instead sells off from resistance.
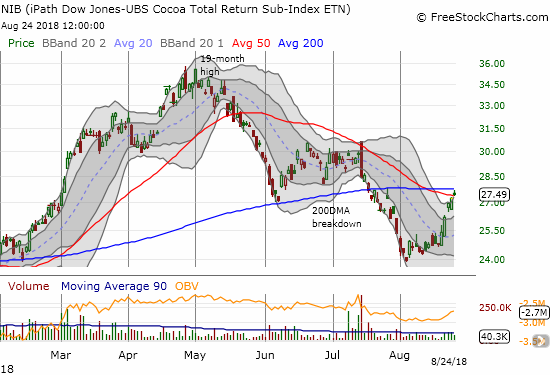
The iPath Bloomberg Cocoa SubTR ETN (NIB) is back in rally mode. It is now over-extended above its upper-BB, so it might need to rest before conquering 200DMA resistance.
Qualcomm (NASDAQ:QCOM)
Buyers followed through on QCOM’s breakout. While the progress has been very consistent, it has happened in reluctant drips. With the stock closing in on recent highs, I decided this spot makes sense for profit-taking. I closed out my shares and call options.
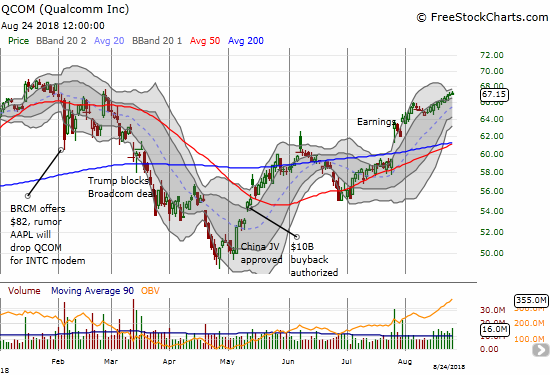
Qualcomm (QCOM) fought tooth and nail to recover recent highs.