The recent rally in the major U.S. indexes, including the S&P 500, ground to a sudden standstill yesterday, and the blood-shedding continues today. The index is about 7% off its all-time-high set on Wednesday, Sept. 2, while the tech-heavy NASDAQ Composite lost over 10%, erasing three weeks of gains in less than two trading sessions. Hence, the saying “bulls take the stairs up, bears the elevator down.”
Why the current rout in the markets?
Well, there is a simple, factual explanation for what is happening: “It is not a stock market, but a market of stocks.” What do I mean by that? Well, the S&P 500 is made up of 500 individual company stocks, and if less and less of these individual stocks are participating in the rally, it is called negative divergence in breadth. At some point, there are not enough stocks left to carry the index higher, not even by the over-weighted mega-cap big-tech stocks like Apple (NASDAQ:AAPL), Amazon (NASDAQ:AMZN), Facebook (NASDAQ:FB), etc. There are many ways to measure “market breadth,” and one of the more popular well-known indicators is the cumulative Advancing/Declining Line (AD). Here I use the NYAD and NYAD Common Stock Only (CSO). The former contains preferred stocks and rate-sensitive issues more closely related to the bond market and is, therefore, a bit “contaminated” compared to the CSO. But I will use both to make my case.
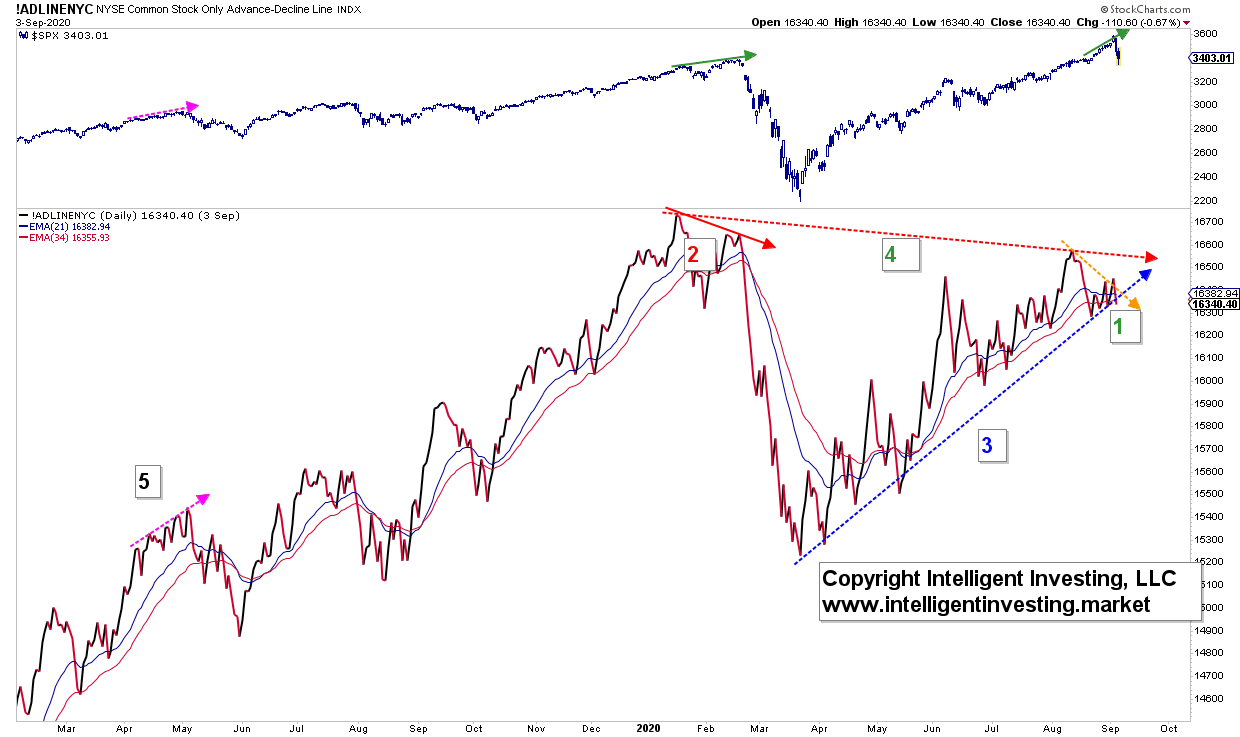
Figure 1 shows the CSO and S&P500 since early 2019, and there are several things we can learn from the chart:
- The CSO has been declining, while the S&P500 has been advancing (green [1], orange vs green arrow)
- Prior such divergence led to the crash in March (red [2], red vs. green arrow)
- The CSO is about to break below trendline support (blue [3]), signalling a change in trend: down
- More prolonged divergence is developing now, which could spell trouble in several months from now if it continues to stay that way (green [4], dotted red arrow). See Figure 3.
- Divergence is not even necessary to usher in a decent correction (black [5], dotted purple arrows), but corrections on no divergences mean the bull will continue once the correction has run its course.
Figure 1, Daily NYAD-CSO and S&P 500

Thus, the market has rallied over the last month or so on fewer and fewer advancing stocks, which meant the rally was exhausting itself. Now, divergence is only divergence until it is not, but after the five-month-long massive rally off the March lows, the bulls ran out of steam, i.e., money.
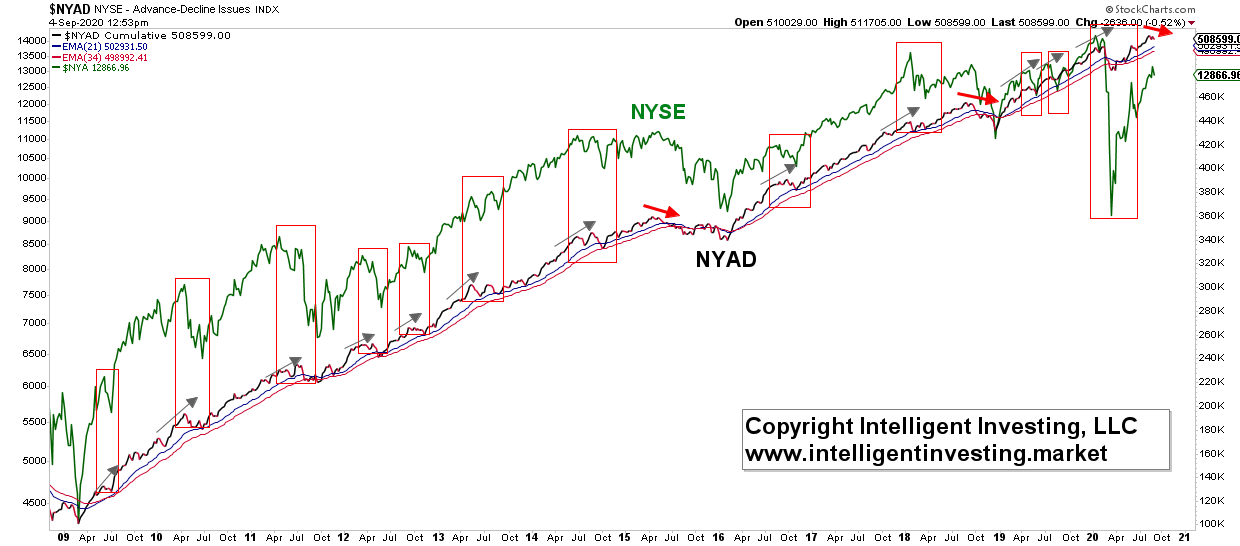
Figure 2 below shows the NYAD on a weekly timeframe, and the first thing you may notice are the grey boxes and grey arrows. They show that even if the weekly NYAD moves higher with the index (NYSE in this case), the market can still experience steep corrections – up to 20% – that will scare most investors out of their positions. Again, divergence is not necessary for a correction to unfold, and as such, the NYAD is not a reliable “[local/tradeable] top is in” indicator.
There are also three red arrows on the chart: in 2015, 2018, and now in 2020. These red arrows indicate a negative divergence between the NYAD and the NYSE on a weekly timeframe. Both in 2015 and 2018, such divergence led to prolonged corrections—around 20% on the NYSE. Currently, there is also such divergence. Albeit n=2, with a 100% track-record in forecasting prior -more extensive- corrections, and knowing divergence is not even needed to usher in deep corrections, the weekly chart warns us of potential trouble ahead in the coming weeks and months.
Figure 2, weekly NYAD and NYSE

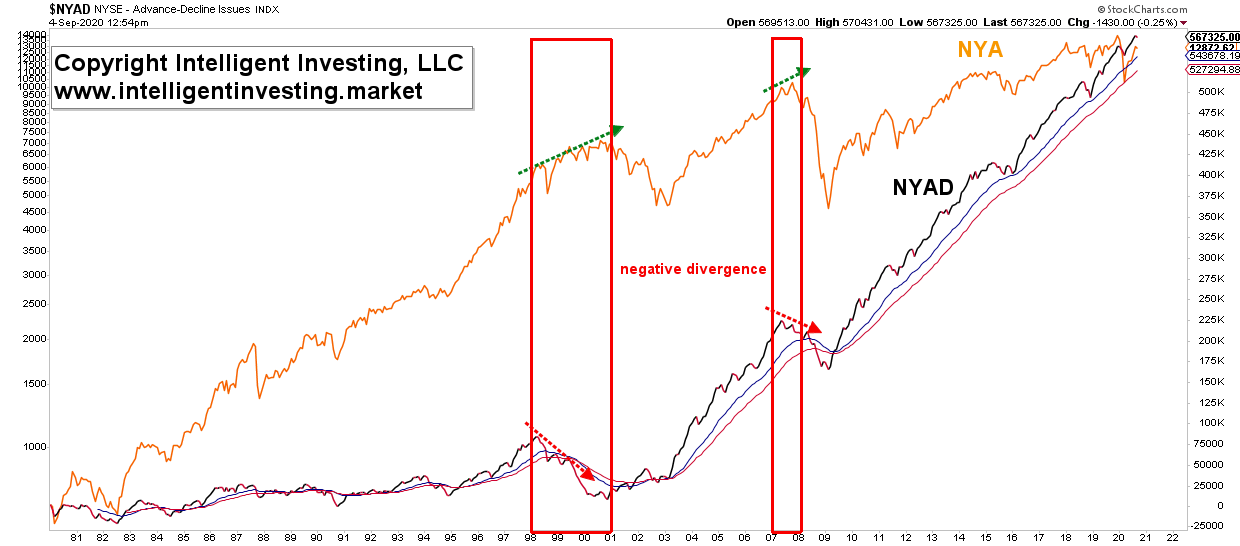
Does this chart tell us the bull since the 2009 low is over? No. To better answer that question, I prefer to look at the monthly timeframe chart. See Figure 3 below.
Here I use the NYAD and not the CSO as I only have data available for the CSO since 2003, which is too little. As you can see, both the 2001-2003 and 2008-2009 bear markets were foretold, well in advance, by negative divergence on the monthly timeframe (dotted arrows and red boxes). Currently there is no such divergence on the NYAD. However, as shown in Figure 1, the “cleaner” NYAD-CSO has a divergence on the monthly timeframe (item [4] on the chart), which deserves continued monitoring because there was also divergence in 2007 when the markets topped out (chart not shown here).
Figure 3, monthly NYAD and NYA

Bottom line: The rally over the last month or so was based on weakening breadth. Fewer stocks were participating. Now, the indexes have finally caught up and are based on prior similar breadth setups, most likely in a multi-week correction. The last two days have been, what I would call, the initiation move. Going forward, expect more downside and strong counter-trend rallies in between. Corrections are full of twists and turns, so please stay nimble. I know my premium major market members enjoy my hand-crafted, well-thought-out factual analyses of the markets grounded in data and not opinions, and I hope you do too. I also hope you moved your stops up as the markets moved higher.
