
Emini daily chart
- The S&P 500 Futures Bulls are getting an upside breakout on the daily chart. The target for the bulls is the July high which is 4,735.75.
- The market has been Always In Long since early November.
- Because the rally has momentum, the best the bears can hope for is a trading range and sideways trading.
- The rally has been away from the moving average for several bars, which is climactic. This will increase the odds of a pullback to the moving average soon.
- While the daily chart is in a small pullback bull trend, it is within a larger trading range. This means that if the bears can develop more selling pressure, the pullback could be much deeper than what the bulls would want.
- However, this would require the bear to get a strong breakout below the moving average, which is unlikely on the first reversal down to it.
Emini 5-minute chart and what to expect today
- Emini is up 2 points in the overnight Globex session.
- The Globex market has gone sideways for most of the overnight hours.
- The bulls are hopeful the sideways trading will lead to a final flag, and create a failed upside breakout.
- The U.S. Session will probably have a lot of trading range price action on the open. Most traders should consider waiting for 6 – 12 bars, before placing a trade.
- That is because there is an 80% chance of a trading range open, and only a 20% chance of a trend from the open.
- Most traders should focus on catching the opening swing that often begins before the end of the second hour.
- It is common for the opening swing to begin after forming a double top/bottom, or a wedge top/bottom.
- The most important thing on the open, is to be patient and not in a rush. It is easy to be excited to trade and get trapped into taking a weaker setup. By waiting for at least 6 bars before trading, a trader will gain more clarity on the day structure, increasing their probability of making money.
Yesterday’s Emini setups
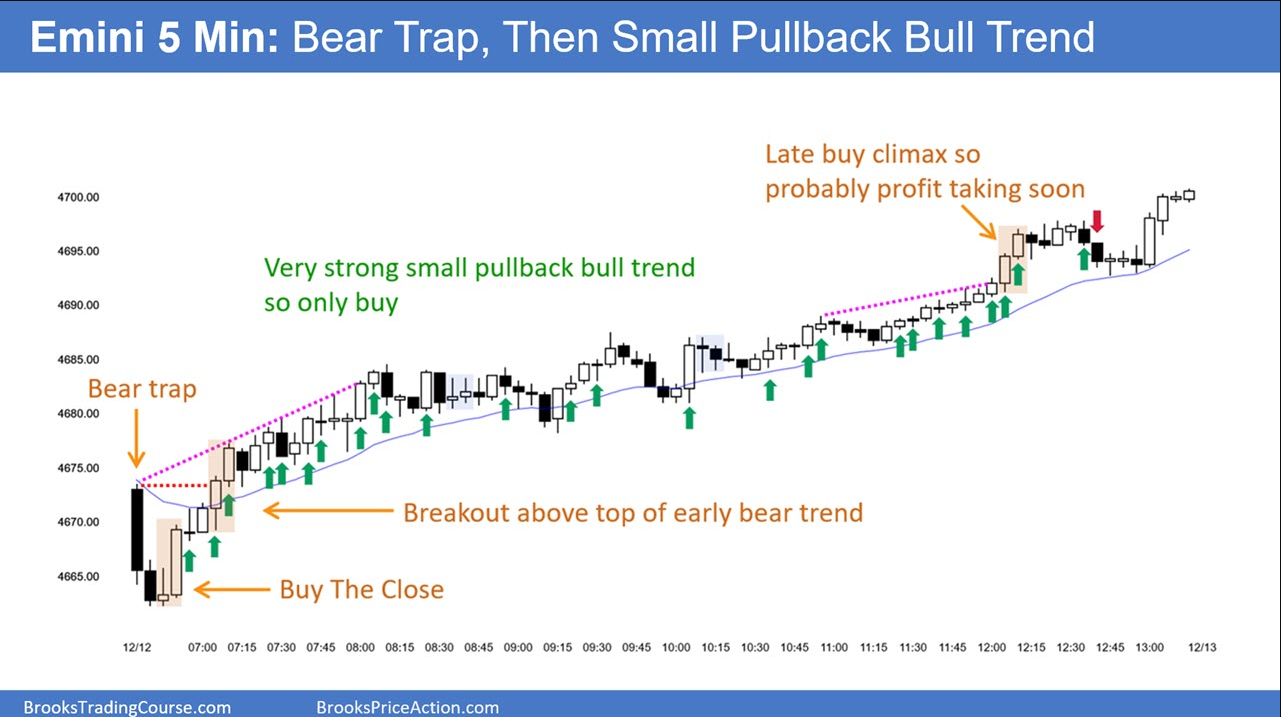 Here are reasonable stop entry setups from yesterday. I show each buy entry bar with a green arrow and each sell entry bar with a red arrow. Buyers of both the Brooks Trading Course and Encyclopedia of Chart Patterns have access to a near 4-year library of more detailed explanations of swing trade setups (see Online Course/BTC Daily Setups). Encyclopedia members get current daily charts added to Encyclopedia.
My goal with these charts is to present an Always In perspective. If a trader was trying to be Always In or nearly Always In a position all day, and he was not currently in the market, these entries would be logical times for him to enter. These therefore are swing entries.
It is important to understand that most swing setups do not lead to swing trades. As soon as traders are disappointed, many exit. Those who exit prefer to get out with a small profit (scalp), but often have to exit with a small loss.
If the risk is too big for your account, you should wait for trades with less risk or trade an alternative market like the Micro Emini.