S&P 500 earnings update
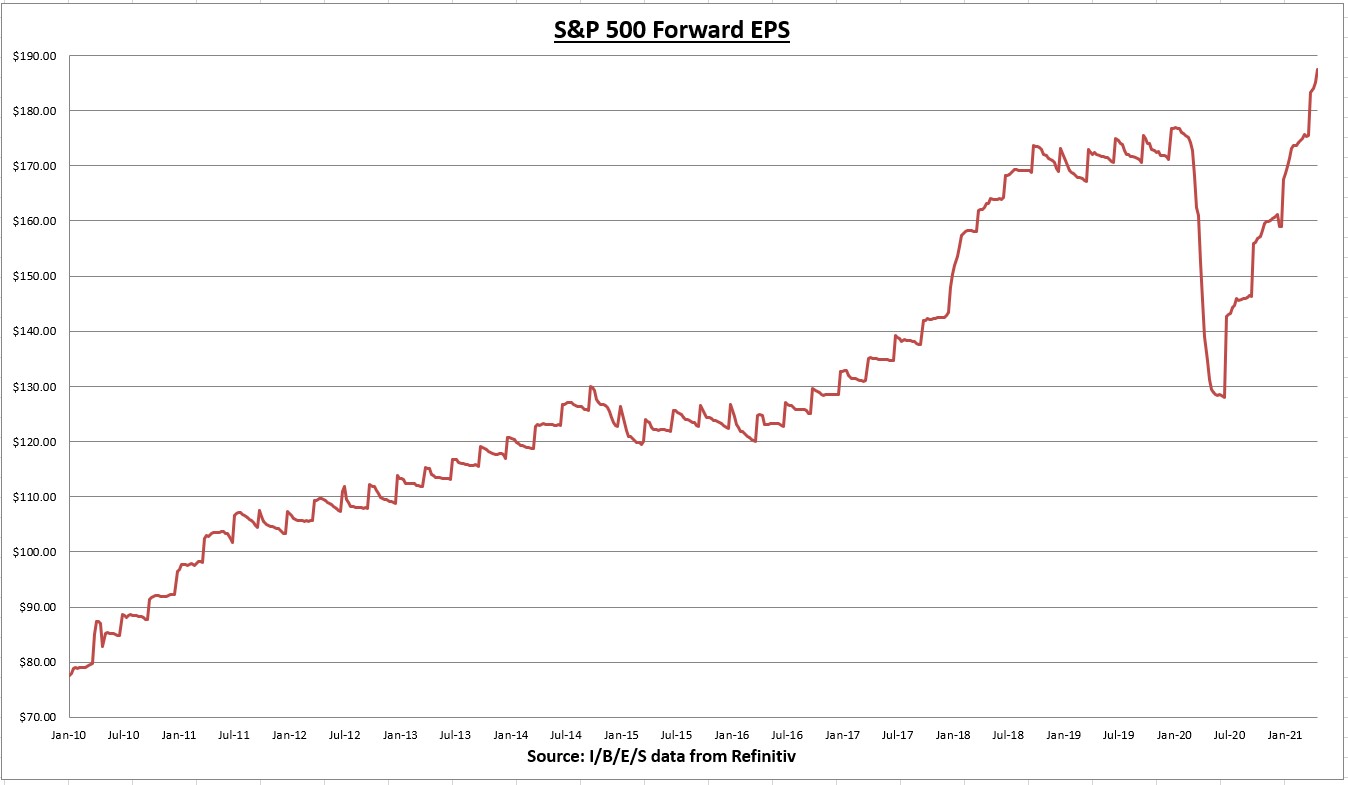
The earnings per share (EPS) for all S&P 500 companies combined increased to $187.50 last week. A gain of +1.35% for the week, and +18% year-to-date.
As of Friday last week, 60% of S&P 500 companies have reported Q1 results. 87% of companies have beaten earnings expectations, and earnings have come in +22.8% above estimates.
Q1 earnings growth is now +46.3%, and full year 2021 earnings growth projections have increased to +32.3%. Also 78% of companies have beaten revenue estimates. (I/B/E/S data from Refinitiv)
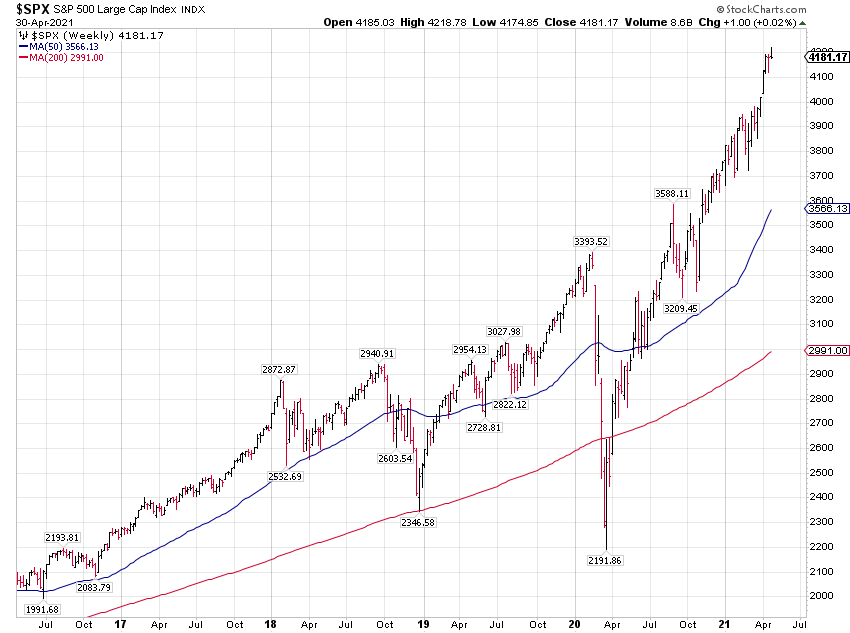
The S&P 500 gained +0.02% for the week.
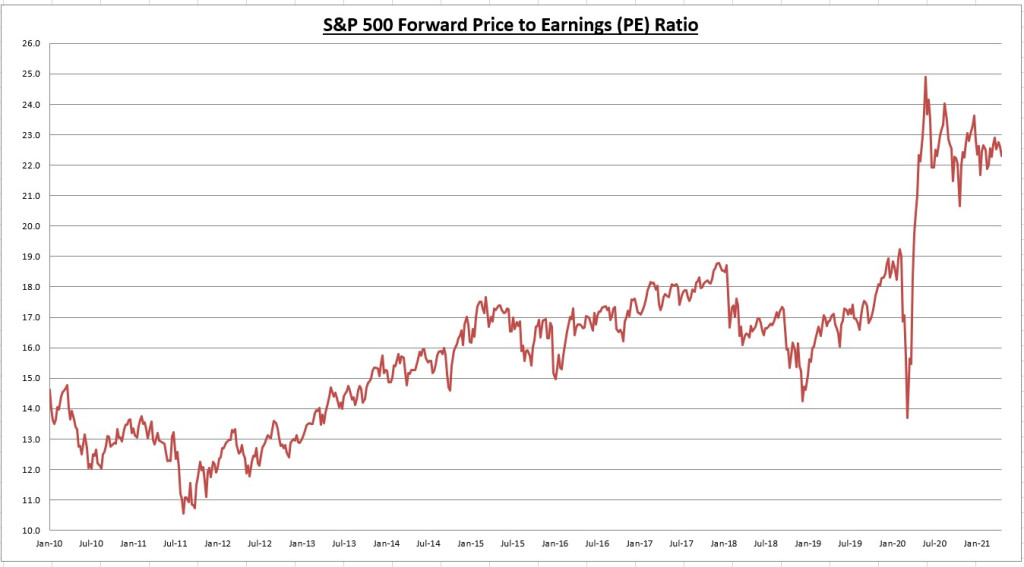
The increase in the EPS (+1.35%) was more than the increase in price (+0.02%), making the valuation a bit more attractive. The price to earnings (PE) ratio is now 22.3.
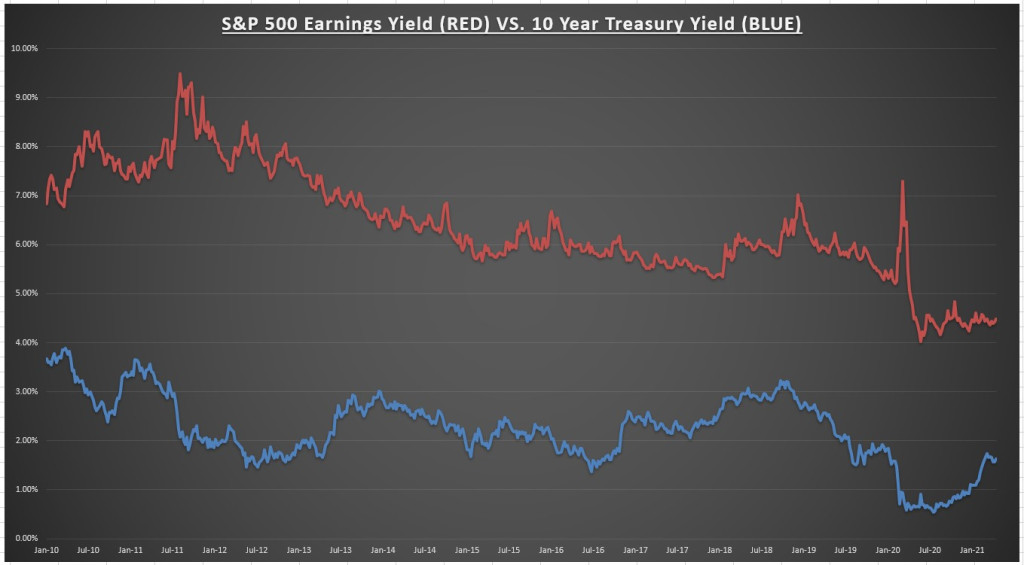
The S&P 500 earnings yield is now 4.48% compared to the 10-year treasury bond rate—which increased to 1.63%. The equity risk premium is now 2.85%. Stocks are still reasonably valued compared to fixed income alternatives.
Economic data review
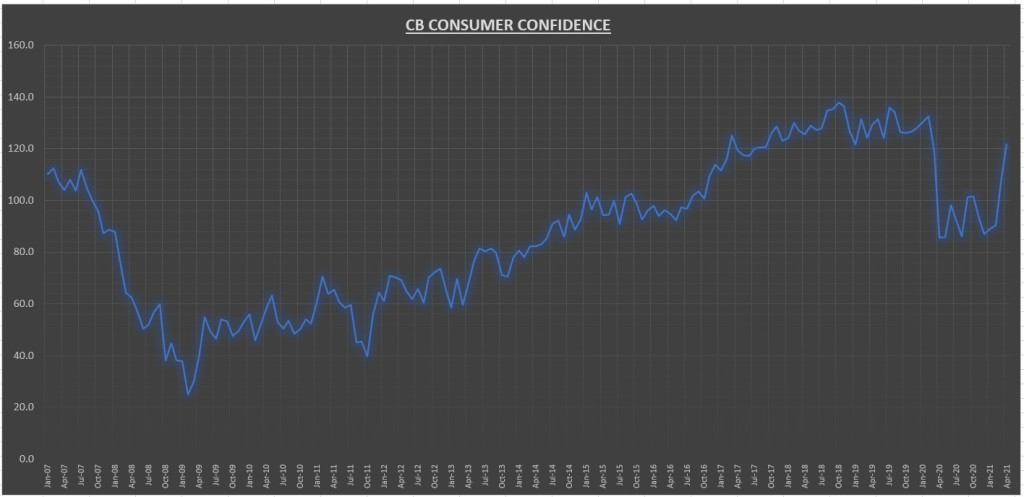
The Conference Board’s consumer confidence index came in at 121.7 for April. A gain of 11.7% over March (which was revised down, from 109.7 to 109.0), and an increase of 42% year-over-year.
“Consumers’ assessment of current conditions improved significantly in April, suggesting the economic recovery strengthened further in early Q2. Consumers’ optimism about the short-term outlook held steady this month.
"Consumers were more upbeat about their income prospects, perhaps due to the improving job market and the recent round of stimulus checks. Short-term inflation expectations held steady in April, but remain elevated.”
Consumers' appraisal of current conditions increased +27% for the month.
The consumer confidence index has now recovered 72% of the COVID decline, but remained 10.4% below all time highs.
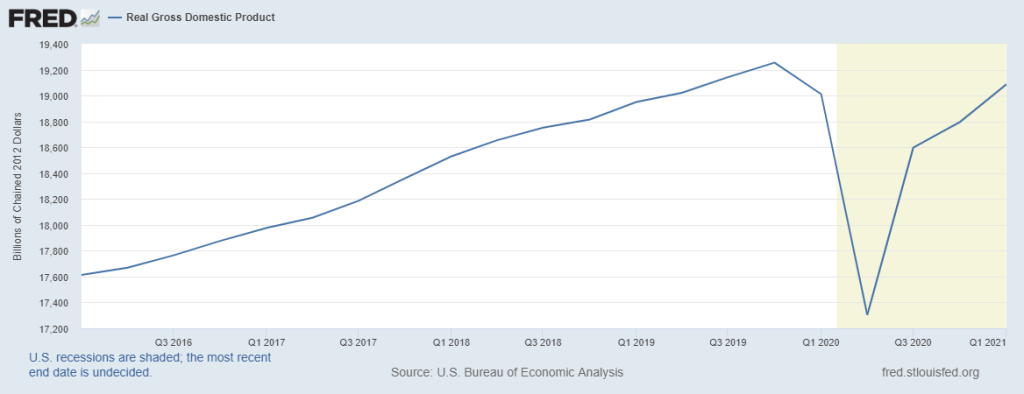
We got our first look at Q1 GDP last week. Real GDP grew 6.4% on an annualized basis in Q1, now at $19.08 trillion. The economy has now recovered 91.5% of the COVID recession, and is likely to make a new record high in Q2.
“The increase in real GDP in the first quarter reflected increases in personal consumption expenditures (PCE), nonresidential fixed investment, federal government spending, residential fixed investment, and state and local government spending that were partly offset by decreases in private inventory investment and exports.”
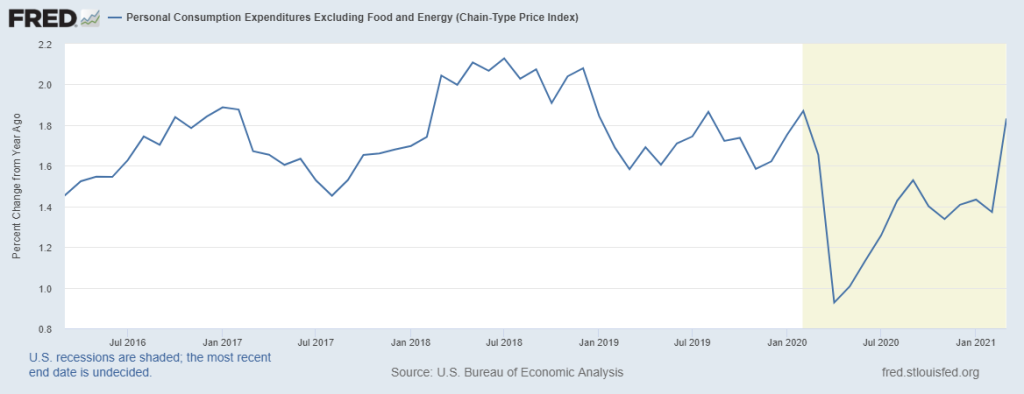
Personal Consumption Expenditures (PCE) excluding food and energy costs (Core PCE) increased 0.4% in March, the highest monthly inflation increase since October 2009. Core PCE is now +1.8% annualized, but still below the Fed’s “averaging above 2%” target.
Core PCE is considered the Fed’s preferred data point on inflation and therefore can have an impact on future monetary policy decisions.
Notable earnings
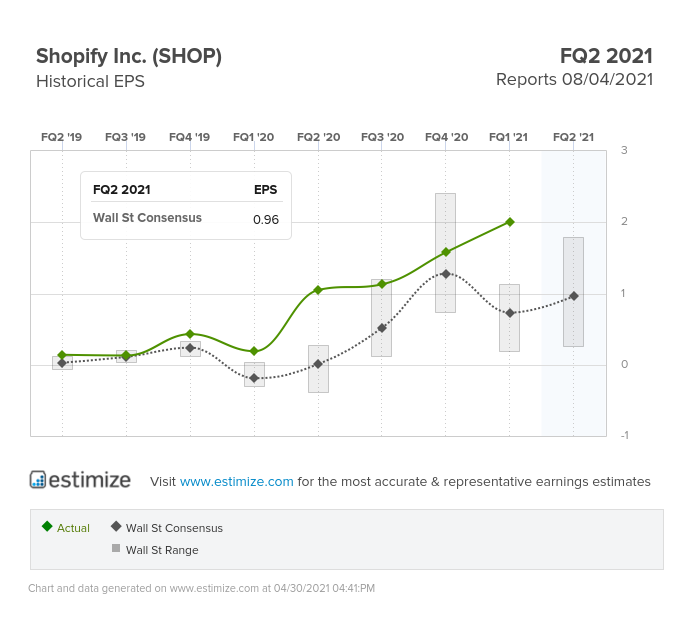
So many key earnings reports last week but not enough time to review them all. A lot of good candidates, but I chose Shopify (NYSE:SHOP) because it was the biggest standout of the bunch. The company reported adjusted EPS of $2.01, which was +175% above street expectations and a growth rate of 958% above Q1 2020 results.
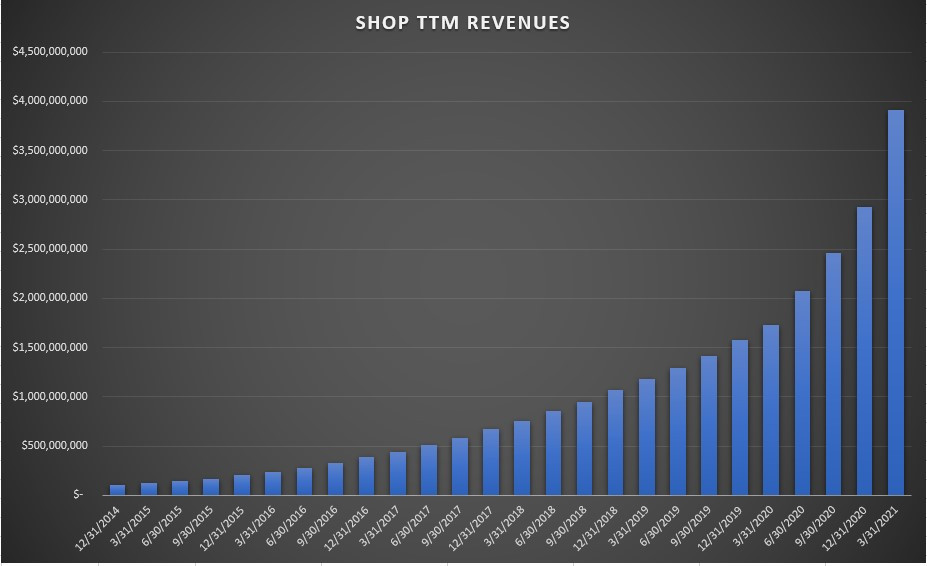
Revenues came in 15% above what the street was expecting, a growth rate of 110% over Q1 2020 results. Subscription solutions grew 71%, while merchant solutions grew 136.5%. Gross merchandise volume (GMV) grew 114%. Total revenues for the last twelve months (TTM) now stand at $3.92 billion.
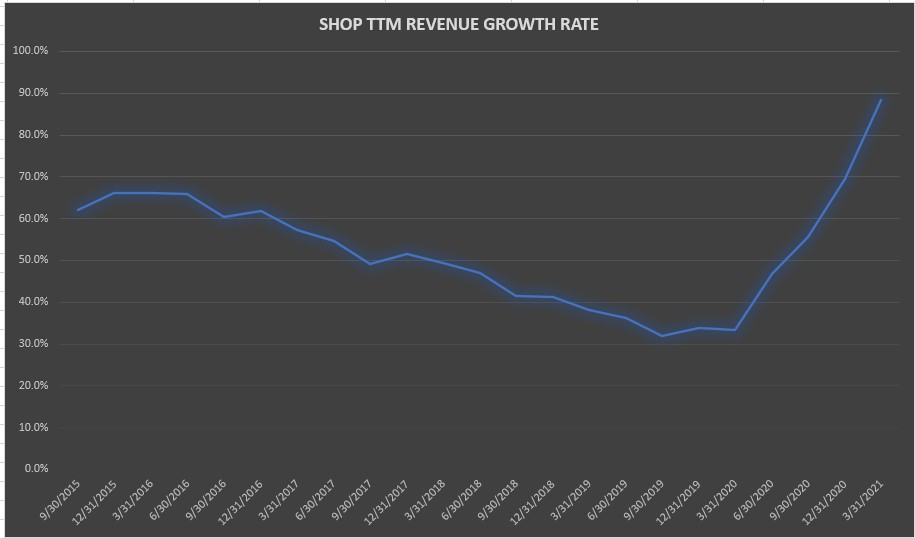
The TTM revenue growth rate continues to increase and now stands at 88.4%, a record high for the company.
Gross margins improved to 56.5%. Operating costs as a percentage of total revenues also improved across the board (Sales & Marketing costs decreased from 33% to 19%, Research & Development costs decreased from 25% to 18%, General & Administrative costs decreased from 10% to 7%).
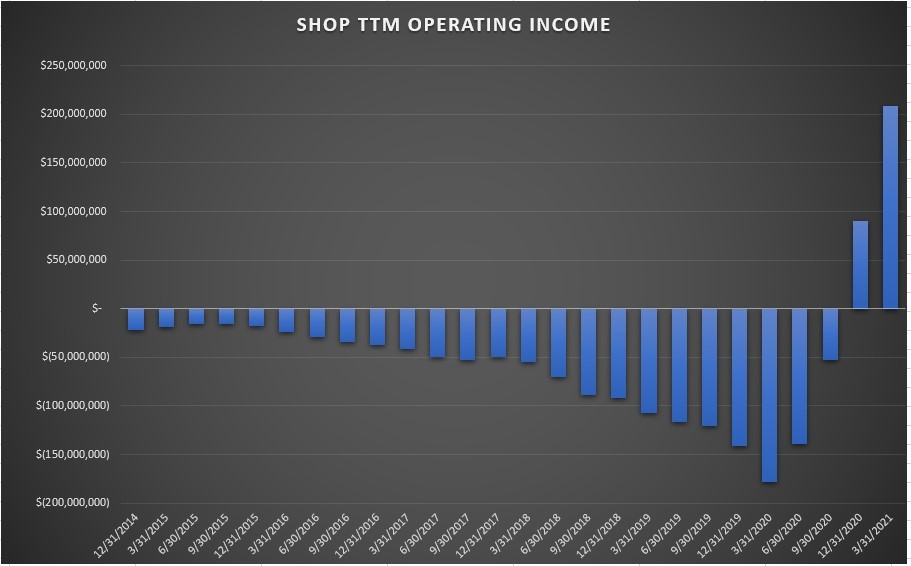
It was the third straight quarter the company reported an operating profit (Q1 2021 operating margins of 12%), pushing the total operating profit reported over the last 12 months up to $209 million.
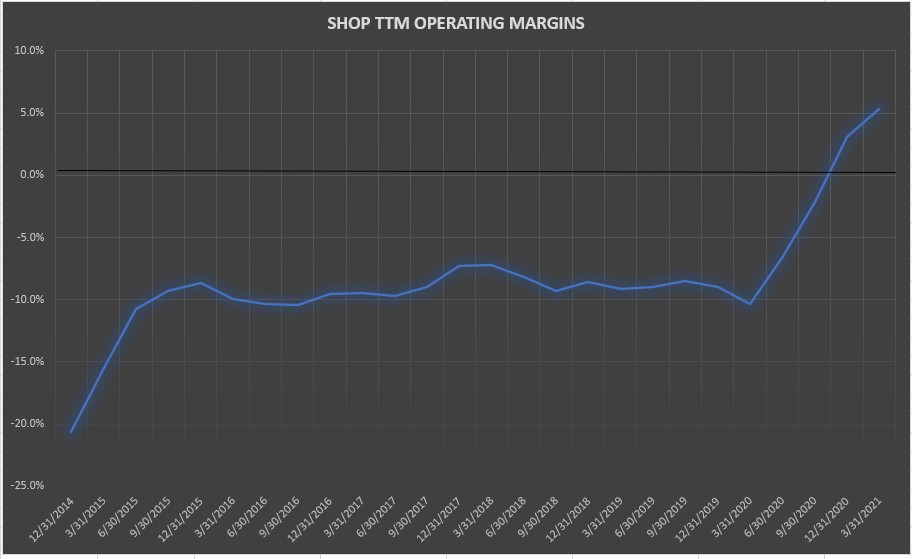
TTM operating margins hit an all time high of 5.3%.
In terms of forward guidance, the company expects further sales growth throughout 2021, but at a lower rate. And they expect operating expenses to increase throughout the year, and for 2021 operating income to be less than 2020.
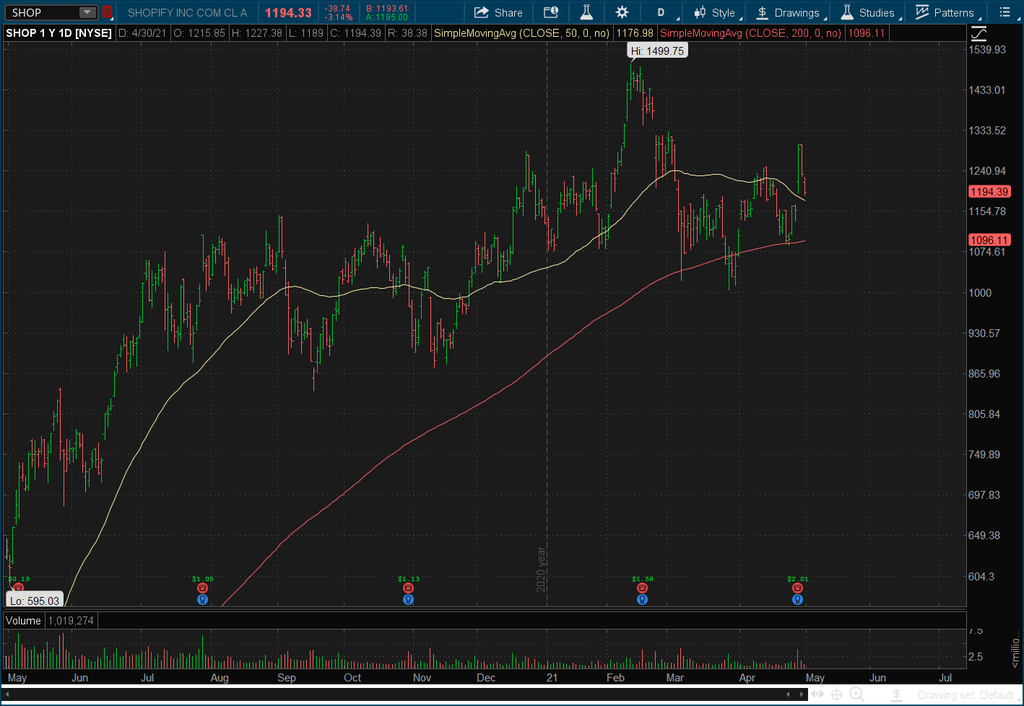
It was a blowout quarter for the company, but the forward guidance might have taken a little of the shine off.
The stock was up as much as 10% post earnings, but has given a good portion of those gains back in the days following. There is no problem with the operating results, but the current valuation (at 50x sales) is already priced near perfection after 2019 gains of 187% and 2020 gains of 185%.
The stock still trades above the 50 and 200 day moving average, but is showing some relative weakness. I maintain a small position in the company with no intentions to sell, but I also can’t bring myself to add at these prices. I’d add to positions if the price fell to the mid to high $800s.
Chart of the week
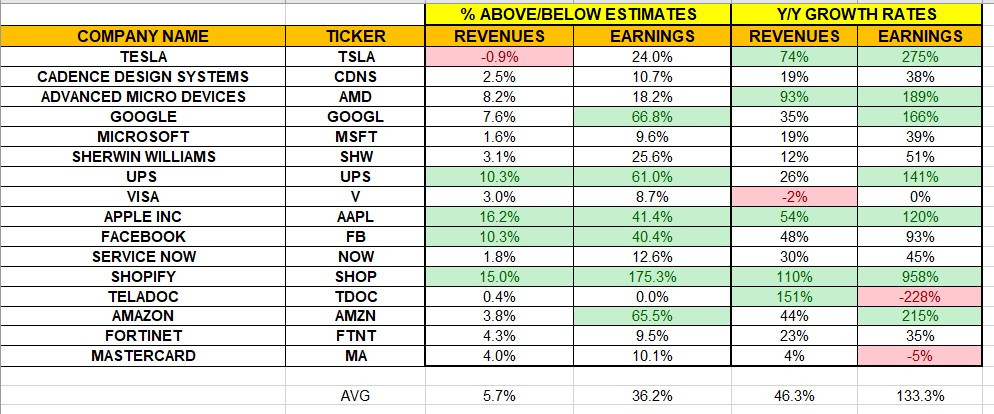
173 S&P 500 companies reported Q1 results last week. The above chart shows the results of the 16 companies I own that reported last week. On average, earnings came in 36% above expectations, while revenues came in 5.7% above expectations. The average earnings growth was 133% and average revenue growth was 46.3%.
Summary
Last week was an all time great week for earnings results. You had $2 trillion dollar companies (in Apple (NASDAQ:AAPL) and Amazon (NASDAQ:AMZN)) report revenue growth of 54% and 44%, respectively. This is unheard of.
Not only did they report astonishing growth rates for such big companies, they reported results that far surpassed expectations. Facebook (NASDAQ:FB), Google (NASDAQ:GOOGL), Apple, and Amazon beat earnings estimates between 40% to as high as 67% above expectations.
It makes me wonder is this as good as it can possibly get?
Stock reactions were relatively modest considering the size of the beat. The NASDAQ actually closed slightly negative for the week. The S&P 500 has nearly doubled since the March 2020 lows, and many of these great companies had 3-5 years worth of stock price gains all in one year.
No one can predict what the market will do in the short term. But the fundamentals are still supportive of risk assets.
This week there are 144 S&P 500 companies reporting Q1 results. I’ll be paying special attention to General Motors GM, PayPal (NASDAQ:PYPL), Twilio (NYSE:TWLO), and Uber (NYSE:UBER) on Wednesday, and Square (NYSE:SQ) on Thursday.
For economic data, we have ISM Manufacturing PMI on Monday, ISM Services PMI on Wednesday, and the employment report on Friday.

