Get 40% Off
🤯 Perficient is up a mind-blowing 53%. Our ProPicks AI saw the buying opportunity in March.Read full update

S&P 500: Determining Price Targets Using Symmetry

Published 10/13/2020, 02:27 PM
Updated 07/09/2023, 06:31 AM

In last week’s update I showed the Nasdaq 100 (NDX) was “stuck in a trading range over the last eight trading days: 11250-11545 (middle black box).” But that “it is still trying to follow the grey path I outlined several weeks ago, with the first up-down pattern complete.”

The grey path is not shown in today’s chart, but it anticipated a next up wave “to target ideally 11840, based on simple symmetry (upper black box).”

Figure 1. NDX100 daily candlestick chart with EWP count.
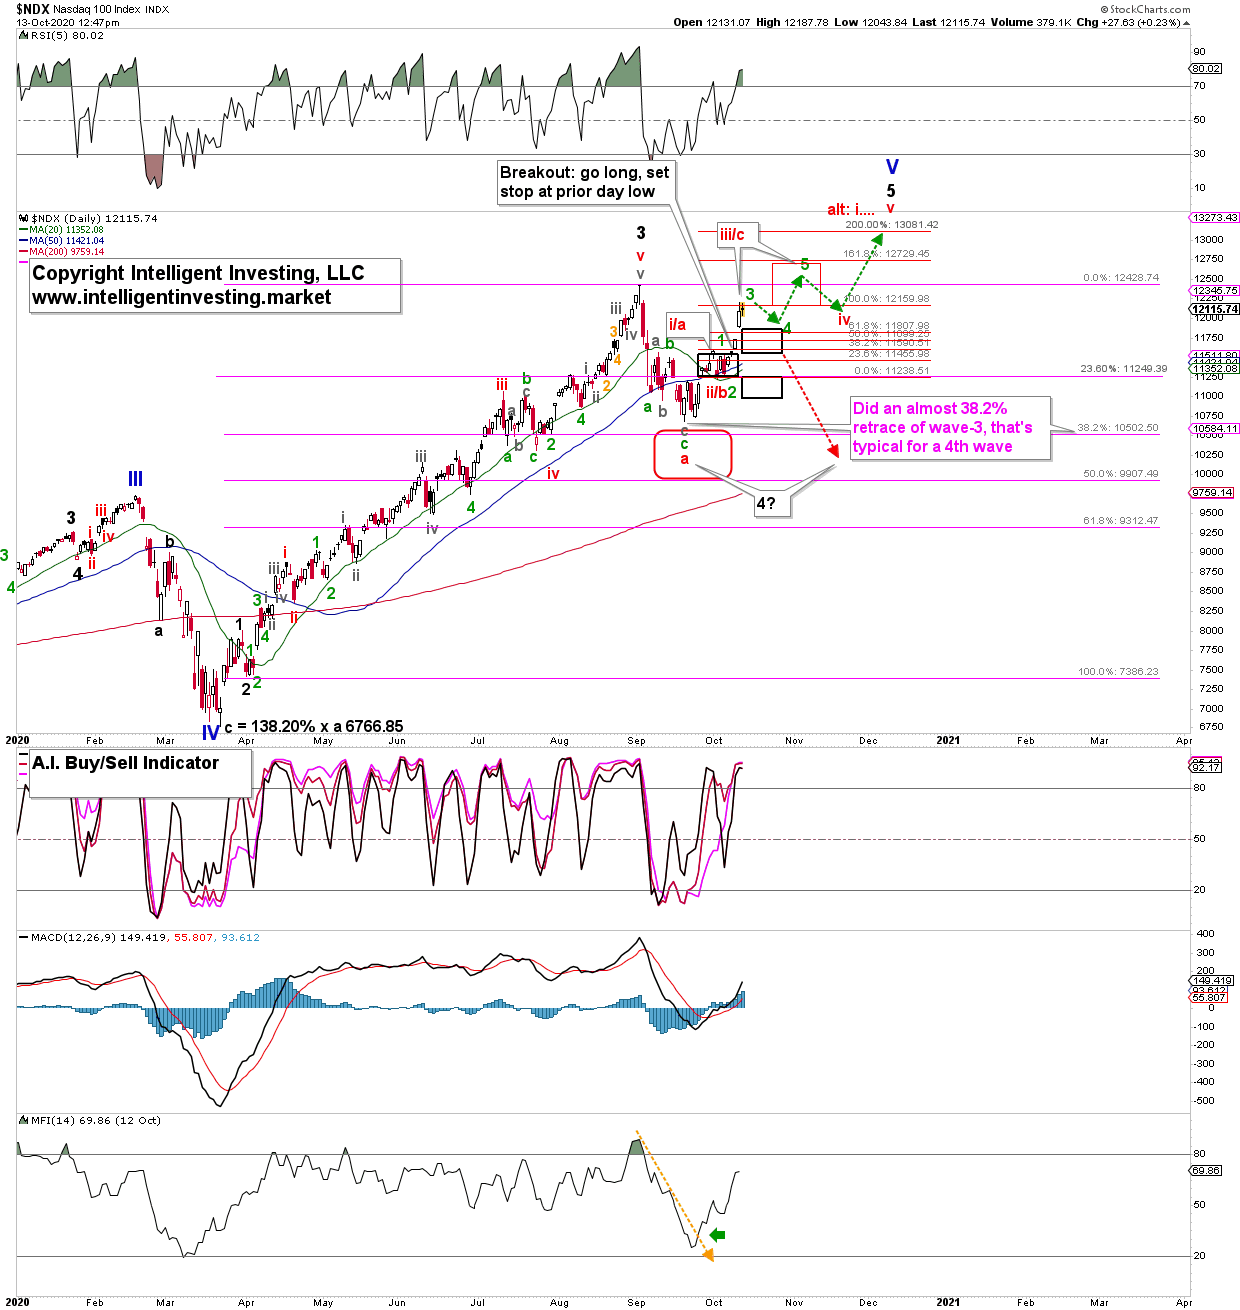
Nasdaq 100 Daily Candlestick Chart With EWP Count.

Last Thursday, the index broke out, as it gapped up above the congestion zone at the open and did not look back. In fact, it exceeded the symmetry target of 11840, as it is now trading at 12125. As you could see on the chart, if you had used my analyses for your trading decisions, the gap up open could have been your cue to go long. I personally prefer to long closes, and on my private twitter trading feed we went long TQQQ on Thursday. I sold two-thirds of our position earlier this week, which netted us +11% so far. Or, as they say, “That was easy!”

Because of the sideways price action last week, I shared that “Elliott Wave is [in such cases] not always the best available tool...” Now that the breakout is achieved, we can, however, use it again. As you can see, the NDX has now reached the 100% extension of red wave-a/i, from red wave-b/ii. So far, the rally from that wave-b/ii low has been three waves. To complete the possible larger (red) impulse pattern, as shown using the green dotted arrows, the NDX must produce a few more waves. That is my preferred scenario because the index is above its rising 20-day, 50-day and 200-day Simple Moving Averages. It likely will be a matter of days before price>20>50>200, which is a 100% bullish setup, and then, a bullish Elliott Wave count is, of course, preferred.

3rd party Ad. Not an offer or recommendation by Investing.com. See disclosure here or remove ads .

As long as the index can stay above the breakout level of 11545, from current prices, it should be able to move higher to at least 12375, and ideally to as high as 12730 for red wave-iii/c. However, if the index breaks below 11590 from current levels, then that is a serious warning to the bulls. In that case, black wave-4 is most likely not complete, and we should see a revisit of the critical 10500 +/-100 level again. If that happens, the recent rally was a larger b-wave of what is called – in Elliott Wave terms – a flat correction for wave-4. Please see my website, https://intelligentinvesting.market/elliott-wave-theory/ for more information about what a flat correction exactly is.

Bottom line: The NDX broke out from the trading range, which was one’s cue to go long the index. The breakout allows me to use Elliott Wave again with more confidence compared with last week. It tells me the index has now reached an inflection point. Either complete a larger impulse to possibly, and ideally, as high as 13080, or only complete a counter trend rally to around current levels possibly as high as 12730. I am personally still long (1/3 TQQQ position left) the index and have moved stops up to lock in remaining profits on any move lower, but to also remain exposed in case the index moves higher.

Latest comments

Hi Dr. Arnout ter Schure If a move is made to 12730 completing wave 5 where does the market typically go from there is it abc down up down then a new 1 up.  abc do not always seem to be clear I often see  additional waves in between what is the correct way to align with the correct count
Anthony, can we be sure whether wave 5 is followed by an a-b-c correction, or if it is followed by an impulsive wave 1? As I see it, we have a presumption that the bull trend will continue until the contrary shows.
If the market does not go below the start of that five wave sequence (September low in this case), but only retraces say 50-60% and then breaks out higher it means the uptrend is extending. then that five wave sequence was only wave-1, the retrace wave-2, etc. IF the retrace exceeds 77% odds increase the five wave sequence is entirely over and no wave-1,2,3, extension will materialize.
Risk Disclosure: Trading in financial instruments and/or cryptocurrencies involves high risks including the risk of losing some, or all, of your investment amount, and may not be suitable for all investors. Prices of cryptocurrencies are extremely volatile and may be affected by external factors such as financial, regulatory or political events. Trading on margin increases the financial risks.
Before deciding to trade in financial instrument or cryptocurrencies you should be fully informed of the risks and costs associated with trading the financial markets, carefully consider your investment objectives, level of experience, and risk appetite, and seek professional advice where needed.
Fusion Media would like to remind you that the data contained in this website is not necessarily real-time nor accurate. The data and prices on the website are not necessarily provided by any market or exchange, but may be provided by market makers, and so prices may not be accurate and may differ from the actual price at any given market, meaning prices are indicative and not appropriate for trading purposes. Fusion Media and any provider of the data contained in this website will not accept liability for any loss or damage as a result of your trading, or your reliance on the information contained within this website.
It is prohibited to use, store, reproduce, display, modify, transmit or distribute the data contained in this website without the explicit prior written permission of Fusion Media and/or the data provider. All intellectual property rights are reserved by the providers and/or the exchange providing the data contained in this website.
Fusion Media may be compensated by the advertisers that appear on the website, based on your interaction with the advertisements or advertisers.
© 2007-2024 - Fusion Media Limited. All Rights Reserved.