
The S&P 500 index reached yet another new local high yesterday, briefly surpassing the 4,785 level. Recently, it retraced all of last Wednesday’s sell-off, and yesterday, it was the highest since early January 2022, coming in less than 20 points below the all-time high of 4,804.51 on January 4, 2022. Investors’ sentiment remains very bullish as we approach the year’s end; however yesterday’s AAII Investor Sentiment Survey showed that 46.3% of individual investors remain bullish, which is lower than the previous reading of 52.9%.
As mentioned on Friday, maintaining a bullish bias is still justified, and the market may have another opportunity to reach new high. However, it’s crucial to pay close attention to the trading action, as there could be more uncertainty and volatility ahead. Nevertheless, I believe it is still justified to maintain the profitable long position.
Yesterday, the S&P 500 gained just 0.14%, reaching a new medium-term high of 4,785.39 - marginally higher than Tuesday’s high by less than 1 point. The market has been extending the uptrend since the release of the FOMC Statement the previous week, which marked a pivot in the Fed’s monetary policy. In early December, the S&P 500 broke above the late July local high of around 4,607, resuming a rally from the local low of 4,103.78 on October 27.
The S&P 500 futures contract is indicating another nearly flat open for the index. The market is likely to further extend its consolidation, despite reaching new local highs. A week ago on Thursday, I wrote that “the likely scenario is a consolidation along 4,700-4800”, and the prediction is proving accurate. How can we capitalize on such trading action? It’s better to shorten the timeframe of the trades and look for buying opportunities at support levels and selling at resistance levels.
It seems that the market may take a little breather following recent trading action. Yesterday’s advance brought the index even closer to the resistance level of around 4,800, as we can see on the daily chart.

Nasdaq 100 Continues Its Uptrend
The technology-focused Nasdaq 100 index has extended its uptrend, reaching new all-time high of 16,922.01 yesterday. While it continues to trade above its month-long uptrend line, there are, however, short-term overbought conditions that may lead to a downward correction at some point. Of course, it’s too early to talk about sell signal, but it’s time to be more cautious, especially considering the elevated bullish sentiment readings mentioned before.

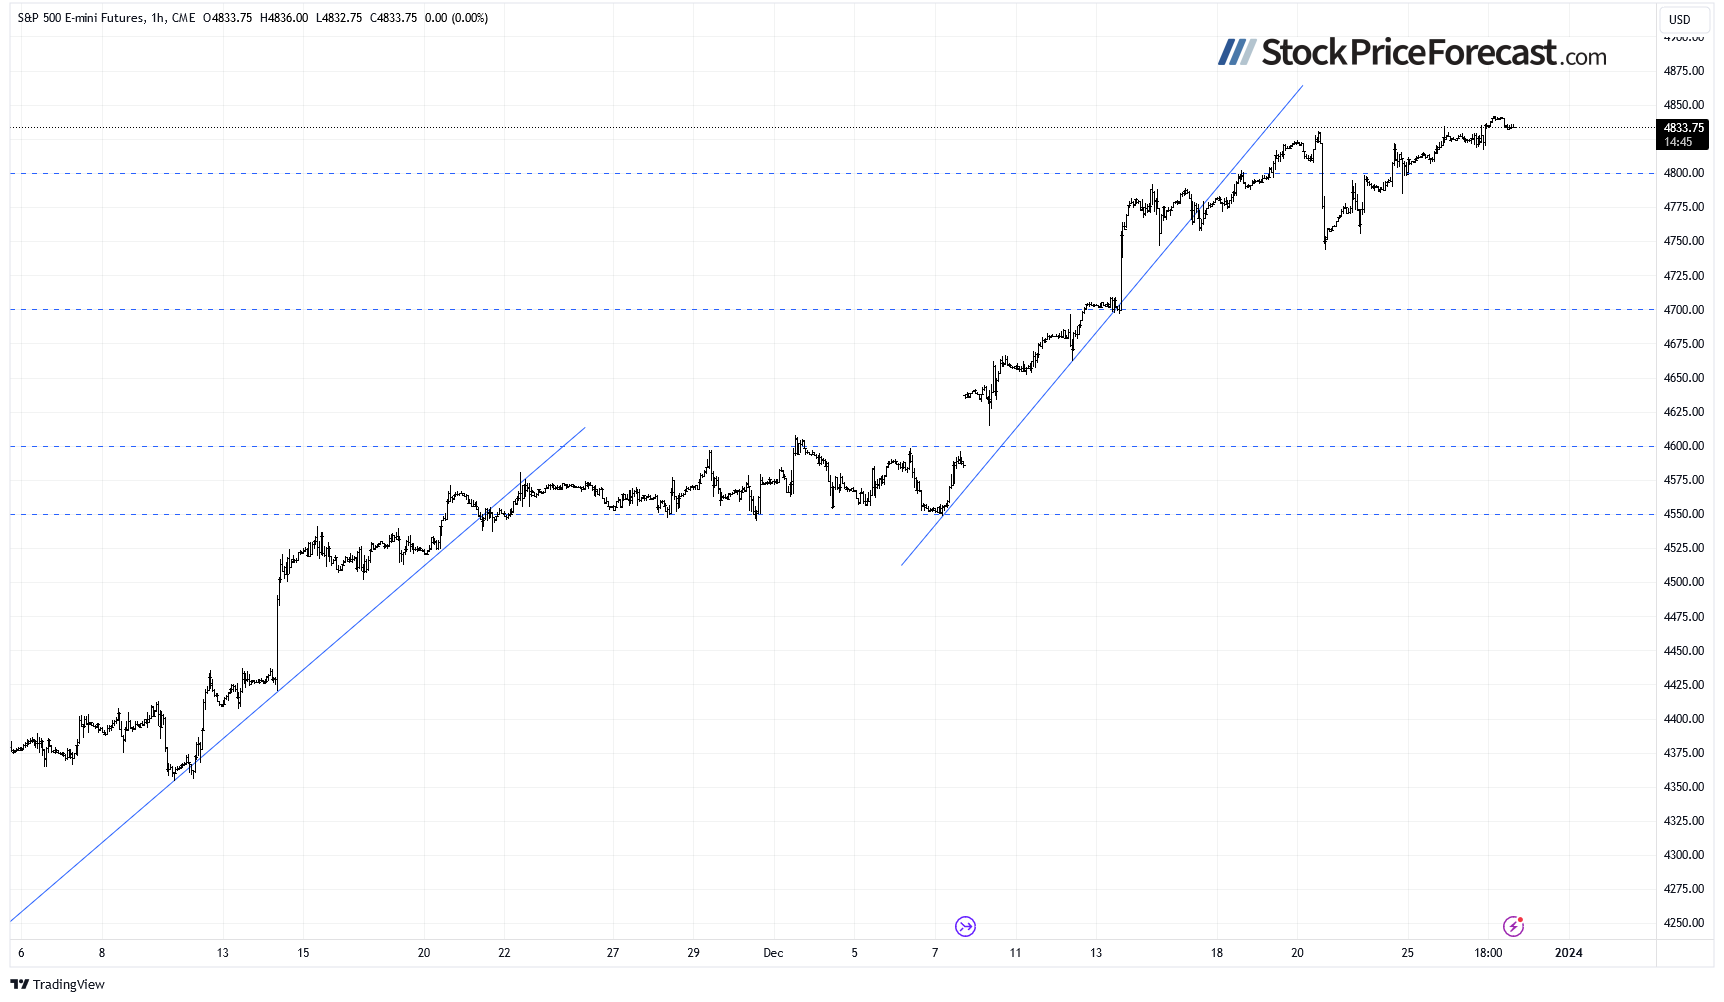
Futures Contract Remains Near Local Highs
Let’s take a look at the hourly chart of the S&P 500 futures contract. Following last Wednesday’s intraday sell-off, it rebounded on Thursday and Friday. Today, mirroring yesterday’s trading action, the market is trading near its local highs. The nearest important resistance level is now at 4,850, with the support level at 4,800.
Conclusion
The long position remains profitable and yesterday it added slightly more gains. Overall the index has gained 789 points since opening that trade at 3,992.4 on Feb. 27. In the near future, I will be looking to close that trade and shift focus to a more short-term oriented trading strategy. For now, it remains justified as stocks may further extend their uptrend.
Stocks slightly extended their uptrend on Wednesday, and this morning, they are poised to trade sideways once again, along medium-term highs. Consequently, the S&P 500 index may have another chance at reaching new highs closer to the 4,800 level. In Thursday’s analysis, I mentioned that “in a short-term the market may see some more uncertainty and volatility”, and indeed, there is a lot of uncertainty following an early-month rally and the recent breakout of the S&P 500 above the 4,700 level. Nevertheless, there is still a chance of extending the uptrend, as no confirmed negative signals have emerged. Returning to the question of whether holding a long position is still justified, it appears that any potential advance will require climbing the wall of worry rather a rallying higher.
Here’s the breakdown:
- The S&P 500 reached a new medium-term high yesterday.
- Currently, there is no clear winner in the ongoing struggle between bulls and bears, but of late, bulls have taken the initiative.
- Short-term uncertainty and volatility may favor trading based on support and resistance levels.
- In my opinion, the short-term outlook is still bullish.