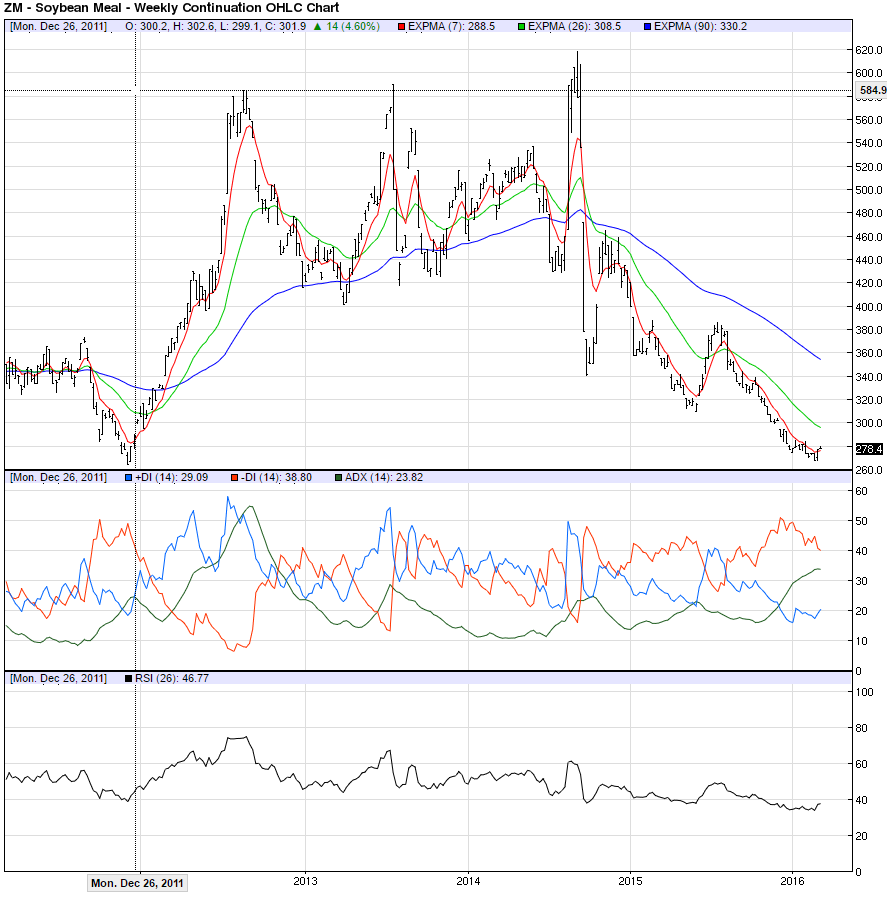
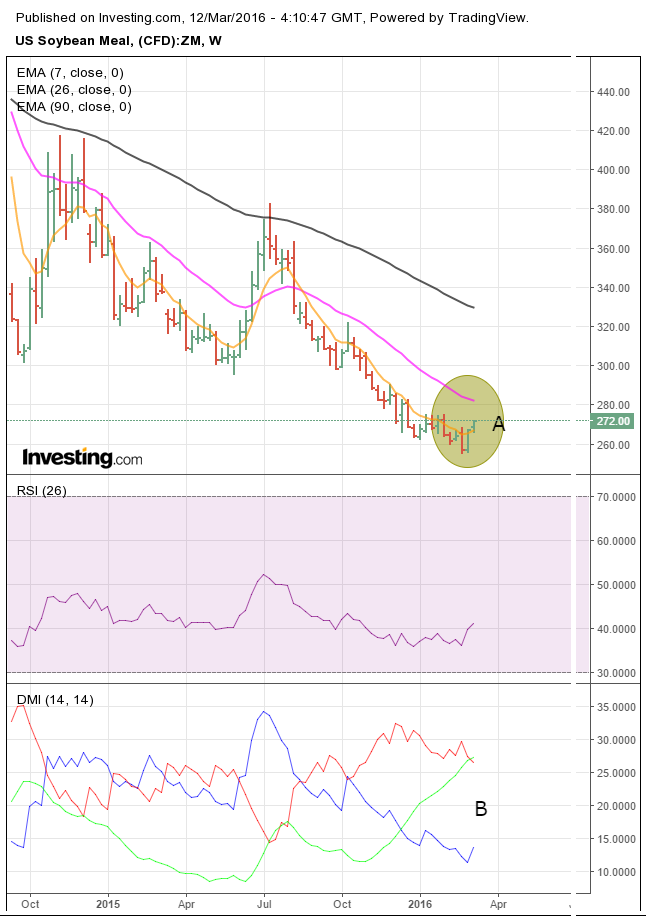
Soybean meal has sold off considerably during the past couple of years. Both the cash and futures weekly charts look bearish.
The Weekly Chart 

If I were trading off these two charts, taking any type of long speculative position would be similar to throwing darts as to the timing of the entry.
- All three EMA periods are pointing down and spread apart nicely
- The – DI and +DI are well diverged with the ADX climbing
From these two charts, I can hardly see any type of tradable correction, much less a change in trend.
The Daily Chart 
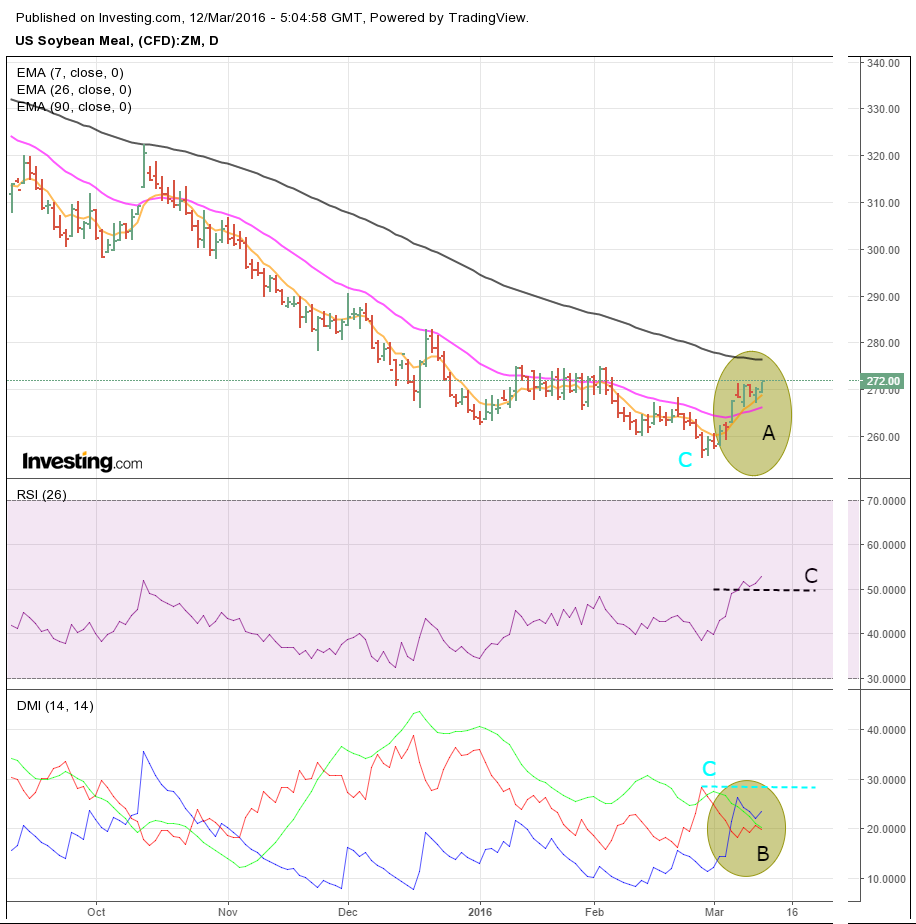
The daily chart provides more possibilities that at least a correction has started. The magnitude of the correction is unknown, but it may be tradable.
- The 7 period EMA has crossed up over the 26 period (A). The 90 period could provide resistance soon that I’ll develop later
- The +DI has crossed up over the -DI (B). The ADX has been falling, signaling that the previous down trend is pausing
- The +DI has remained below the peak of the -DI that corresponds to the low price (C). Should the +DI take this out and hold, the ensuing correction could be sizable in either price and/or time
- The 26 period RSI has pushed above 50 (D)
The Hourly Chart 
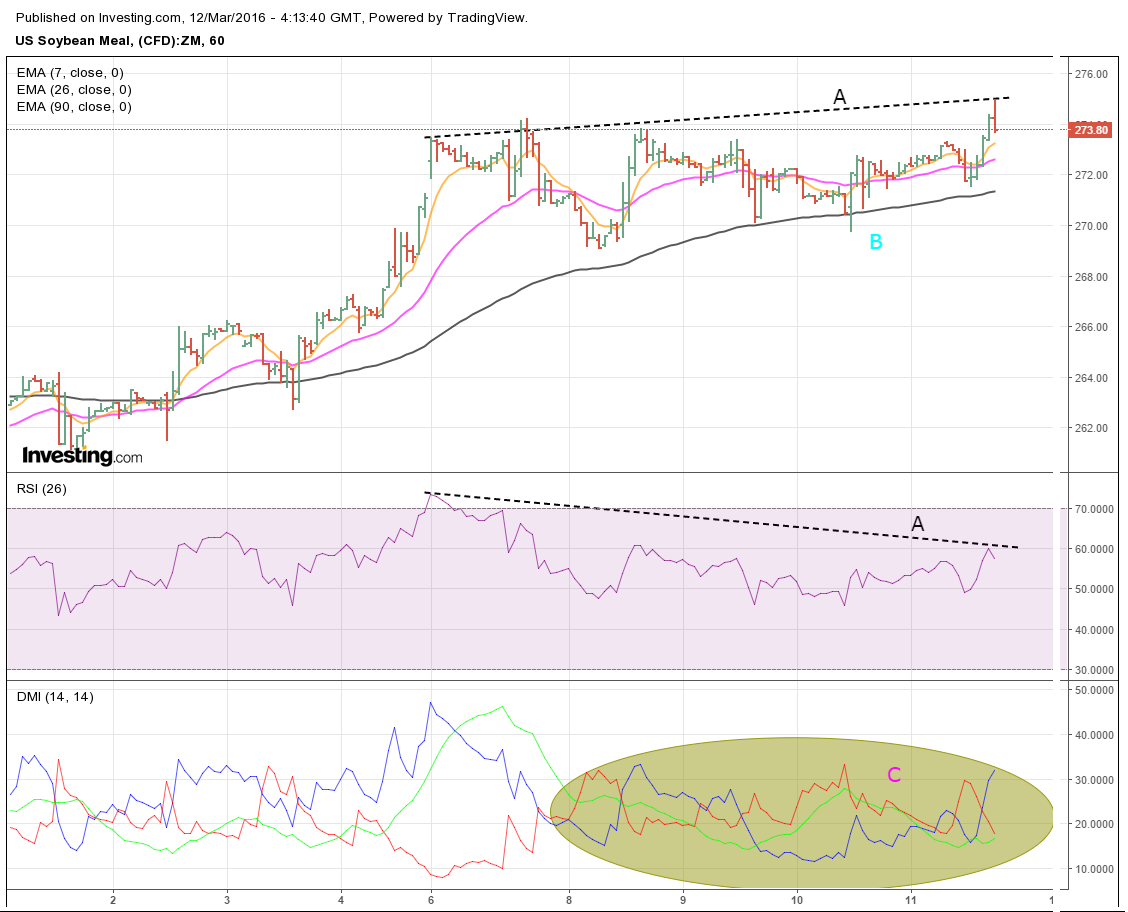
- The 90 period EMA has held price and both the 7 and 26 period EMA since March 2nd (B)
- The 26 period peaked into the 70s but has been diverging with price for several days (A)
- The ADX has fallen since its peak around the 7th, signaling the uptrend has weakened. Additionally, it has moved above and below 20, signaling a non-trend with the +/-DI exchanging crossovers (C)
What to Watch
- Price! On the daily chart, this will be key to see if it continues up to the 90 period EMA before any pullback. On the weekly chart, this type of price action could put it in the same area as the 26 period EMA, which could prove further resistance
- On the daily chart, the 26 period RSI remains near 50
- On the daily chart, the +DI continues to hold above the -DI
A possible scenario: Price tests the daily 90 period EMA along with the weekly 26 period EMA. Should it hold, watch to see what price does on a pullback into the daily 7 and 26 period EMAs. If the daily 7 and 26 EMA hold price and the 26 period holds 50’ish, a long trade could be made.
If, however, the resistance isn’t there on a pullback, then the existing downtrend is mostly likely continuing.
