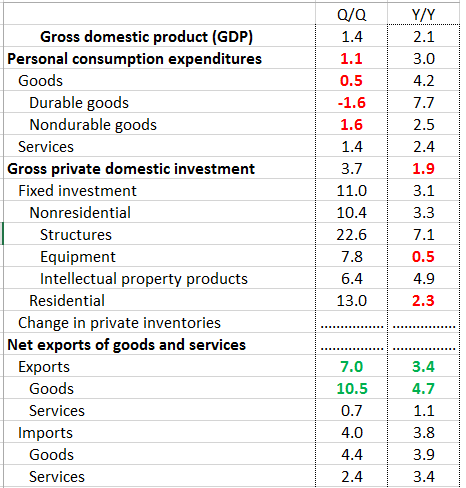
This week, the BEA released their final numbers for 1Q GDP. This table shows the numbers for the Q/Q numbers (left column) and Y/Y numbers (right column):

Starting with the Q/Q numbers (left column) Consumer activity was weak during the first quarter: durable goods spending dropped 1.6% while nondurable goods expenditures increased a paltry 1.6%. Because consumer spending is responsible for 70% of U.S. economic growth, weakness here will always be a statistic drag.
On the plus side, total exports increased 7%; goods orders rose a healthy 10.5%. Y/Y growth (right column) was far more typical, with topline growth of 2.1%. Equipment and residential spending were weak. Like the Q/Q numbers, the Y/Y numbers saw a good increase in exports, which rose 3.4% due to a 4.7% expansion in goods exports.
On Friday, the BEA released the latest monthly personal consumption expenditures report which showed a weak .1% M/M increase. This report’s details are a bit concerning:

Durable goods spending (outlined in red) declined in 3 of the last 7 months; it was weak in 2 others. It’s possible that the two months of strong gains satiated short-term demand, leading to weaker readings in the other months. But that’s a big “if.” Topline spending (outlined in green) has been weak in 4 of the last 5 month. This is especially important because the Fed is assuming that low unemployment will naturally lead to continued strong consumer spending. The above data doesn’t support that conclusion.
Economic Conclusion: this week’s data was modestly bullish, but with an uncomfortable bearish undercurrent. We knew 1Q growth was weak. But even so, the Y/Y comparisons weren’t fatal. However, the PCE numbers cast a shadow over this week’s data. While we’re used to weak 1Q data, the most recent PCE numbers provide cause for concern. So far, this data isn’t showing up in real retail sales. But, we should definitely pay attention to the weakening trend.
Market Overview: this week saw some fairly large and important technical developments. Let’s start with the weekly sector performance:

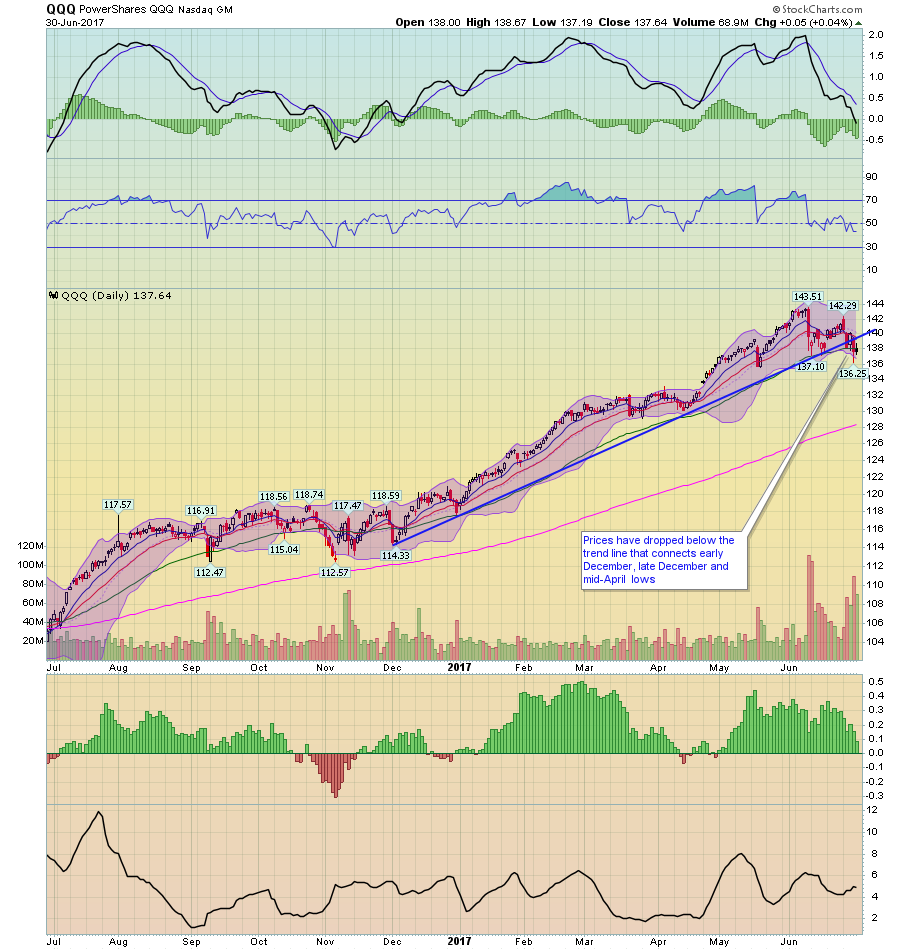
The larger averages (the SPYs and DIAs) were off marginally. Oddly enough, the IWCs rallied .75%. However, the QQQs sold off fairly strongly for the week. More importantly, there were some important technical developments with the chart:

First, momentum (MACD, top panel) has dropped sharply. Prices have fallen through the longer-term trend line connecting several lows from the last 6 months. Volume during this sell-off was much stronger than that of the rally for the last year.
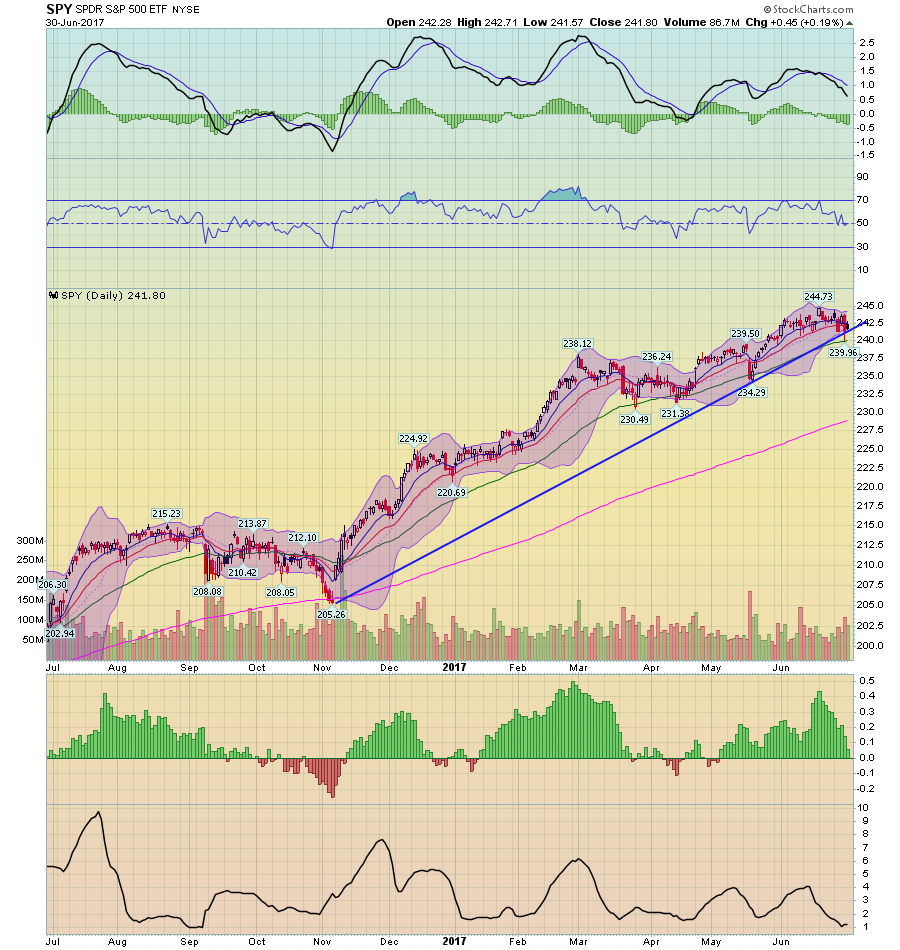
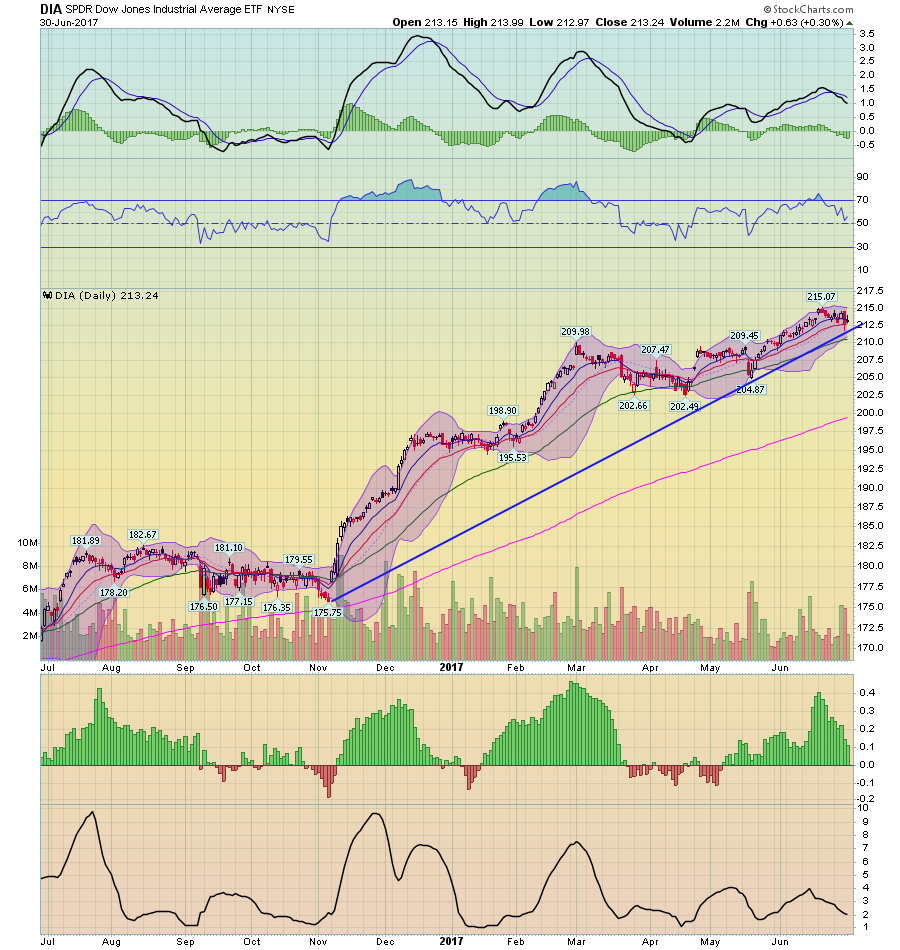
There’s a fairly high probability that the QQQs will pull the SPYs (top chart) and DIAs (bottom chart) lower:


Both indexes have weakening momentum readings and are trading right at technical support. Adding to the potential for a downward move is the expensive nature of the market along with a large number of stocks above their respective 50 and 200 day EMAs. And the possibility of a correction is compounded because of the time: the market is entering the “summer doldrums” when a large number of Wall Street people take vacations, which increases volatility.
A correction would hardly be fatal. The market is expensive, so lower prices would increase value. But the Fed is also tightening while we’re starting to see minor weakness in some of the numbers: auto sales are lowed, PCEs have weakened (see above), 1st quarter growth was weak employment gains are dropping and wage growth has been weak. Given all that, a move lower might actually be a good development.
