In the weekend post I mentioned that due to the strong market breadth I would be looking for long candidates for the short-term trades. The Software industry in the Technology sector is showing improving breadth and the Dow Jones US Software Index (DJUSSW) is outperforming the Technology Sector SPDR (XLK) in January. The screening process has given several candidates in this industry for a long trade.
After reviewing charts I opened a partial long position in Nuance Communications (NUAN) today. But before going to the trade let me give you a sample how I analyse P&F charts deciding if it is an appropriate candidate for a particular trade.
NUAN is a candidate for a short-term long trade. Though I am planning a short-term trade, I want to be sure that the longer-term trend is in alignment with my short-term directional trade.
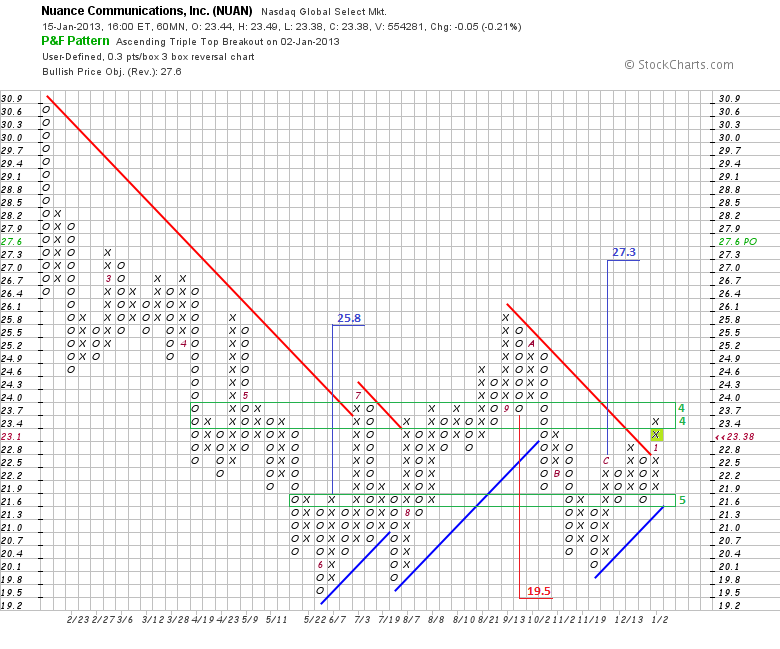
Here is the medium-term 0.3x3 60 min chart. This is the 3 box reversal chart and the box size is volatility adjusted. We see that in July the price made an attempt to reverse the medium-term downtrend at the same time establishing and activating the bullish vertical count with a target at 25.8 from the June low. The first attempt failed but the price was stopped short from the June low indicating the weakening bearish pressure.
The second attempt to break through the Bearish Resistance line in August was successful and the price reached the price objective from the June low precisely. After that the bears intercepted a ball again and tried to resume the downtrend. The bearish vertical count from the September high gives 19.5 as a price target. All they could do, however, was a higher low in November.
Reaching the bullish target and a failure to reach the bearish count target shows a gradual shift from weakening supply to strengthening demand. In January the price broke out above the descending Bearish Resistance line again. A new buy signal at 23.1 (lime box) validated this breakout. Actually, if you look a little bit left, you see two failed bearish attempts (two columns of Os) to break below support at 21.6 in December. In both cases the bulls responded with a higher column of Xs and a new buy signal, thus re-asserting themselves.
This kind of the price action has strong bullish implications. The vertical bullish count from the November low points to 27.3 and the price is currently battling against the resistance zone at 23.4-23.7. So, the medium-term chart is bullish, but to be sure that we don’t miss anything let’s take a look at the 1 box reversal chart.
I’d like to note here that 1-box and 3-box charts are two completely different methods of charting with different construction principles and, therefore, different interpretation. Both contain information that may not be visible otherwise. So, it is useful to look at both of them analyzing the price action. A 1-box reversal chart by construction has a higher frequency of changing columns and, therefore, has a shorter-term horizon than a 3-box reversal chart. 
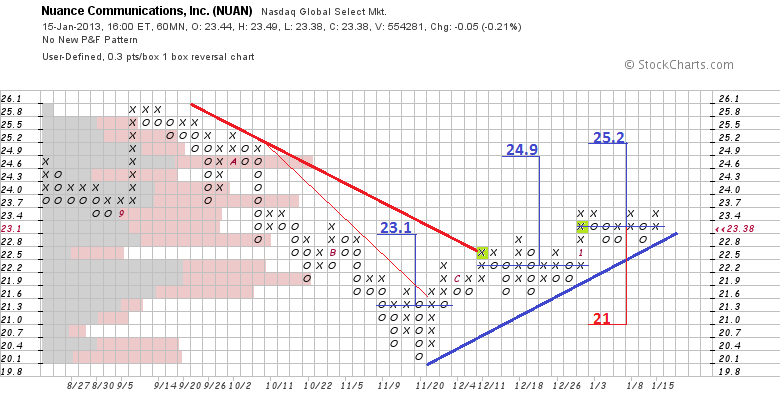
On the NUAN 0.3x1 60 min chart we see that the price formed a reversal fulcrum bottom in November and broke out from it generating a full catapult buy signal at 22.5 (lime box). Though, the price broke through the internal subjective bearish resistance (thin red line), the main subjective Bearish Resistance line was not broken decisively and the target from the horizontal bullish count at 23.1 from the November bottom was not achieved. So, at that time it would be wise to let the price show its intentions before taking the medium-term long trades.
The price went sideways in December and later issued a semi-catapult buy signal at 23.1 confirming the reversal. Note that the new buy signal coincides with the previous bullish price target. We can now draw the subjective Bullish Support line (blue) and count a new price objective from the December congestion area.
Here are a couple words about horizontal counts on 1-box charts. There are 4 different methods to count price targets from congestion areas on 1-box charts. All of them are valid. It’s a matter of preferences. On this particular chart I used the row with the most filled boxes in a congestion area as a count row. The December congestion pattern gives 24.9 as a bullish price target.
It's worth mentioning that until we have a breakout column from a congestion area and a new buy or sell signal on a 1-box chart, we can’t say whether a developing count is bullish or bearish. Thus an analyst keeps two potential counts on an unfolding sideways pattern and removes one of them when the direction is clear. You see that there are two counts on the narrow congestion pattern which is unfolding in January.
Taking into account the previous bullish character of the price action odds are high that this pattern will break upward but until it happens we keep bullish and bearish counts. As you already realized, the height of a count is proportional to the width of a pattern. So, the bullish target at 25.2 (as well as bearish) from the January congestion is not the final one and can be changed if the price continues its sideways trend.
The main conclusion from this chart is that the price is in the confirmed medium-term uptrend and the nearest bullish price targets reside in the 25 area. The price objectives from horizontal counts on 1-box charts are closer than on 3-box charts (due to construction differences) and new counts appear more often.
We can extract more information from the medium-term charts but for the short-term trade what we got is enough. It’s time to switch to the short-term charts.
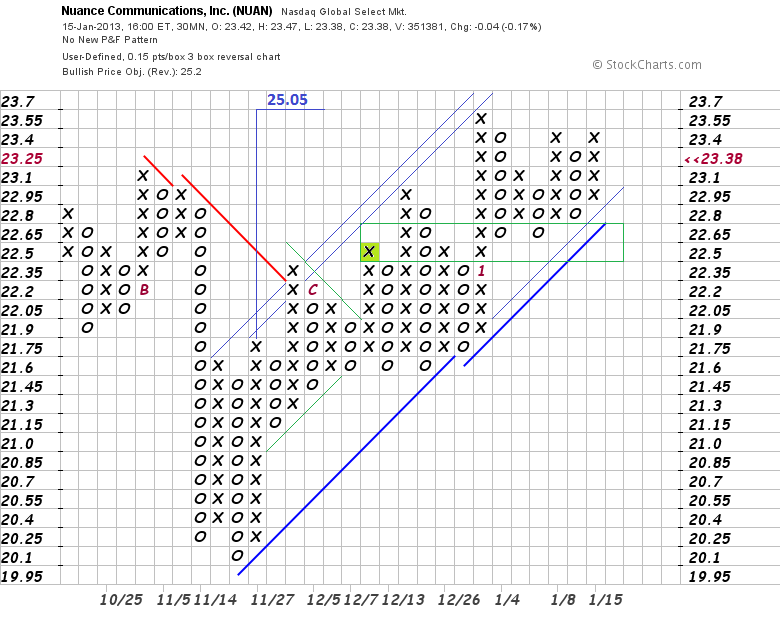
This is the short-term 0.15x3 30 min chart. The time horizon of this chart is a bit shorter than the previous one. We see that the price is moving upward within a pretty compact trend channel. There is a continuation Symmetrical Triangle pattern right under the Bearish Resistance line. The up thrusting column of Xs from this Triangle generated a new buy signal (lime box) which confirmed the trend reversal.
The bullish vertical count from the November low points to 25.05, the same area where targets from congestion zones on the 1-box medium-term chart reside. It underscores the significance of the 25 area. When the price moves closer to the upper and lower trend channel boundaries it signals about overbought or oversold conditions. In this case, based on the character of the current short-term uptrend, we can expect a retracement or resuming of upward movement.
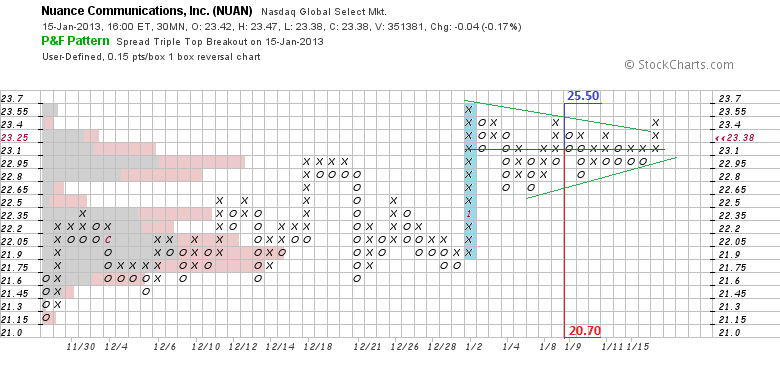
And finally the short-term 0.15x1 30 min chart. Here we can see details of the January congestion pattern. Visually, it looks like a Symmetrical Triangle – a continuation pattern. We can see that the rows with the most filled boxes in this pattern are located closer to the downside. It means that the most action occurs at the bottom of the pattern – the sign of accumulation.
The horizontal count gives 25.50 on the upside and 20.70 on the downside (remember, horizontal counts give bullish and bearish counts until there is a clear breakout). The pattern is in process of formation and the counts are not final. In addition, if we assume that it is a continuation triangle than the following move should be equal to the move before the pattern. I highlighted the entering column of 12 Xs in blue. Adding it to the potential breakout point at 23.25 gives the target at 25.05. The 25 target zone looks more and more important.
Today, when the price moved to the lower boundary of trend channel on the short-term 3-box chart I opened a partial long position in NUAN.
11.00 AM Bought to open NUAN Feb13 22 Call 5 contracts at $1.59.
The partial long position was open because the price was declining and a possibility existed that the rising trend channel could be broken on the downside. At the same time the risk was well defined and contained. A break below the lower boundary would trigger a Triple Bottom sell signal on the short-term chart and lead to the position closing. I may add to the position on a new buy signal.
I don’t know if this trade will be a winner or loser. I just wanted to share with you in this post what kind of analysis I perform on P&F charts before entering a trade. P&F charts help to analyse the pure price action and can be a very powerful tool in a trader’s arsenal.
Disclaimer: I express only my personal opinion on the market and do not provide any trading or financial advice (see Disclaimer on my site).
- English (UK)
- English (India)
- English (Canada)
- English (Australia)
- English (South Africa)
- English (Philippines)
- English (Nigeria)
- Deutsch
- Español (España)
- Español (México)
- Français
- Italiano
- Nederlands
- Português (Portugal)
- Polski
- Português (Brasil)
- Русский
- Türkçe
- العربية
- Ελληνικά
- Svenska
- Suomi
- עברית
- 日本語
- 한국어
- 简体中文
- 繁體中文
- Bahasa Indonesia
- Bahasa Melayu
- ไทย
- Tiếng Việt
- हिंदी
Software Industry In Technology Sector Shows Improving Breadth
Published 01/16/2013, 01:33 AM
Updated 07/09/2023, 06:31 AM
Software Industry In Technology Sector Shows Improving Breadth
3rd party Ad. Not an offer or recommendation by Investing.com. See disclosure here or
remove ads
.
Latest comments
Install Our App
Risk Disclosure: Trading in financial instruments and/or cryptocurrencies involves high risks including the risk of losing some, or all, of your investment amount, and may not be suitable for all investors. Prices of cryptocurrencies are extremely volatile and may be affected by external factors such as financial, regulatory or political events. Trading on margin increases the financial risks.
Before deciding to trade in financial instrument or cryptocurrencies you should be fully informed of the risks and costs associated with trading the financial markets, carefully consider your investment objectives, level of experience, and risk appetite, and seek professional advice where needed.
Fusion Media would like to remind you that the data contained in this website is not necessarily real-time nor accurate. The data and prices on the website are not necessarily provided by any market or exchange, but may be provided by market makers, and so prices may not be accurate and may differ from the actual price at any given market, meaning prices are indicative and not appropriate for trading purposes. Fusion Media and any provider of the data contained in this website will not accept liability for any loss or damage as a result of your trading, or your reliance on the information contained within this website.
It is prohibited to use, store, reproduce, display, modify, transmit or distribute the data contained in this website without the explicit prior written permission of Fusion Media and/or the data provider. All intellectual property rights are reserved by the providers and/or the exchange providing the data contained in this website.
Fusion Media may be compensated by the advertisers that appear on the website, based on your interaction with the advertisements or advertisers.
© 2007-2024 - Fusion Media Limited. All Rights Reserved.
