
Going from strength to strength, but isn't a soft patch in stocks drawing near? Or, better yet, aren't we entering it with today's premarket action? The bulls have shaken off anything coming their way recently, and I continue to think it'll turn out as a blip on the screen.
S&P 500 in the Short-Run
Let’s start with the daily chart perspective (charts courtesy of http://stockcharts.com ):
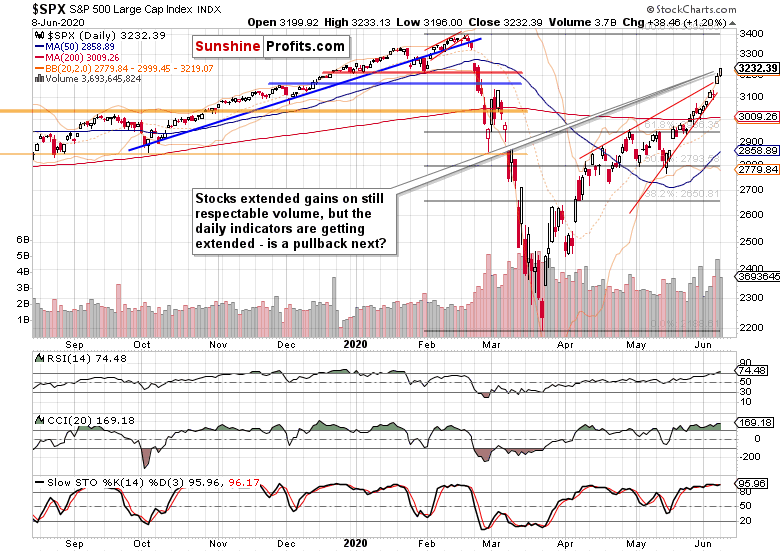
Another day with higher stock prices still. While the lower volume than during Friday's spectacular upswing is no fly in the ointment, the extended daily indicators are one – but merely of short-term nature.
Why do I think that? Sure, the bears can force a test of the upper border of the rising red wedge – but will they be able to bring prices back below that in a way that will last? Is such a reversal of fortunes on the cards right now?
Unless the Fed missteps tomorrow, that's not likely. And I don't really expect them to rock the boat in any meaningful way. The calls for more fiscal stimulus have been made, and the efforts towards accomplishing it are being made. The S&P 500 price action is telling us that the markets expect both parties to iron out the differences, with the end result being a stimulus bill to cheer. That's how I interpret the price action thus far – regardless of the premarket decline driven by weak Geman export data. Do credit markets agree that the trend of generally higher S&P 500 prices is intact?
The Credit Markets’ Point of View
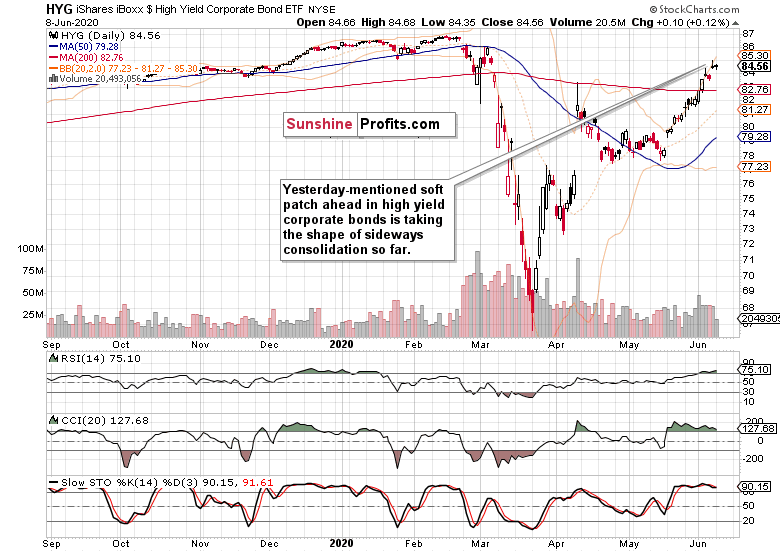
High yield corporate bonds (HYG ETF) seem to be decelerating, but the breather so far took shape of a sideways move with lower bond values soundly rejected. Yesterday's hesitation also happened on lower volume, which is consistent with what we see in a pause within a trend. In other words, the trend is up and we haven't seen a true reversal yesterday.
Would the leading credit market ratios confirm this view?
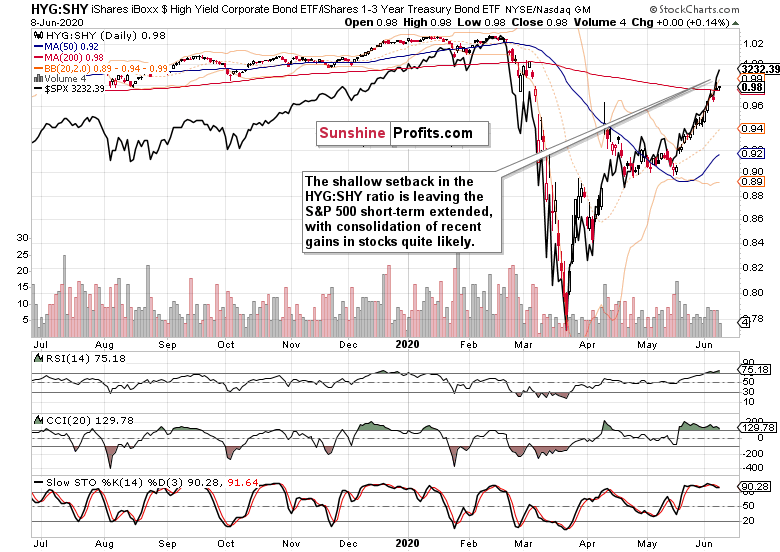
Yesterday's HYG consolidation is mirrored in its ratio to shorter-dated Treasuries. It's just stocks that diverged with their upswing, sizable part of which came in the final 30 minutes before the closing bell.
While such price action is bullish (stocks want to go up, after all), it leaves them in an extended position, relatively speaking. But given the HYG:SHY setback suffered so far, is that a cause for more than a very short-term concern?
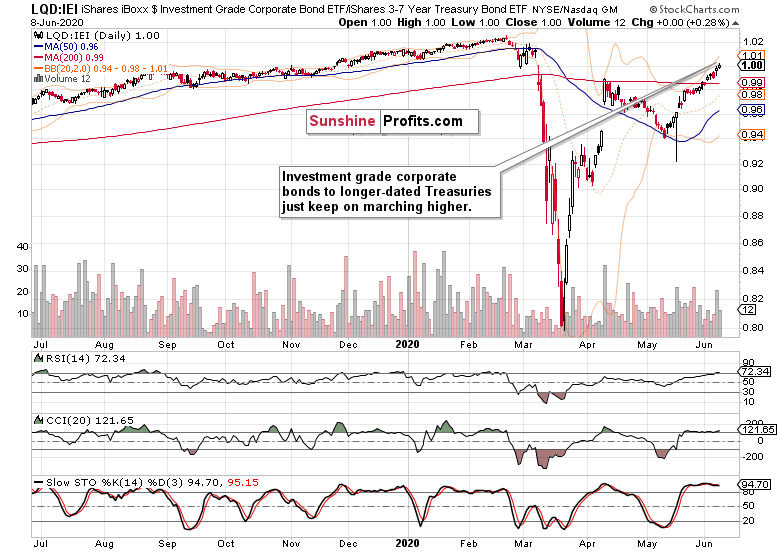
Investment grade corporate bonds to longer-dated Treasuries (LQD:IEI) are unyielding in their rise. Both leading credit market metrics point to a rather limited downside in stocks that I shouldn't really view as anything but a perfectly natural micro-rotation.
Both the 3-7 year Treasuries (IEI ETF) and 20+ year Treasuries (TLT ETF) recovered a bit of lost ground yesterday. Neither that, nor the USD Index pause is a game changer, though. Look at gold. It's been unwilling to sell off much so far. Will it do so in the runup to the USDX upleg? What upleg when Treasuries' closing prices are largely giving the appearance of being ready for more downside before resuming their long-term uptrend?
Will the Fed deliver a deflationary squeeze tomorrow that would take traders out of their risk-on and inflationary-hedges? I don't think so. That's why the current environment of inflation picking up and money printing as far as the eye can see is fundamentally conducive to higher stock prices. Money is being created faster than it's being destroyed. Technically, I've laid out the position of the credit markets. Will volatility analysis enrich our view?
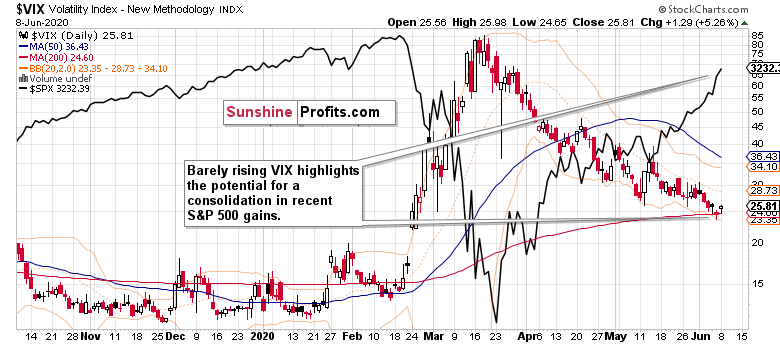
The VIX has moved a little higher against the backdrop of rising stocks. Given the case for limited downside potential in stocks, the favorite volatility measure supports that assessment. It's because during bull market runs, the VIX doesn't make sharp spikes that would make one look for much more still. Instead, it's bobbing around with a measured jump here and there amid generally falling or sideways values.
Now, VIX falling to around 6 as happened not all that long ago, that would be extreme complacency and mature stock bull market. We're nowhere near that currently.
Does the sectoral analysis support my thesis of the stock bull market having much further to run?
Key S&P 500 Sectors in Focus
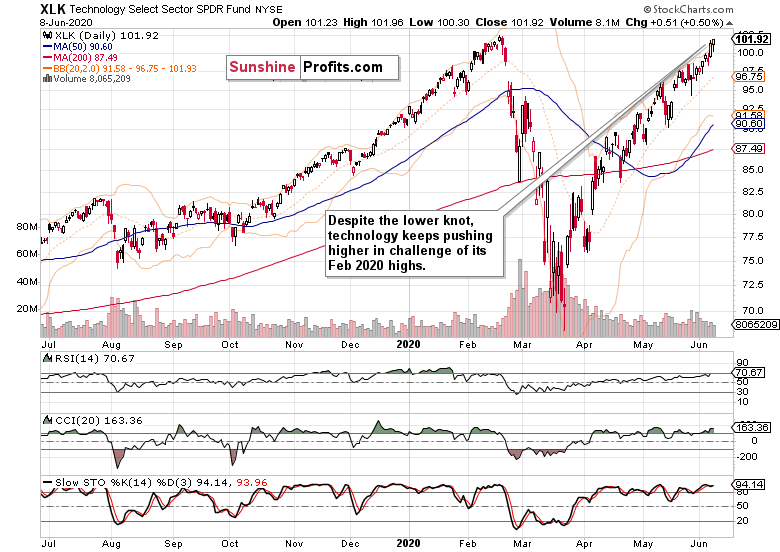
Move on, the uptrend in technology (XLK ETF) is intact whatever intraday selling it meets. With the 2020 highs within spitting distance, the only question is how much of a resistance will they provide – both in time to overcome them, and in depth of price corrections to work out the extended daily indicators' readings before the bulls say enough is enough.
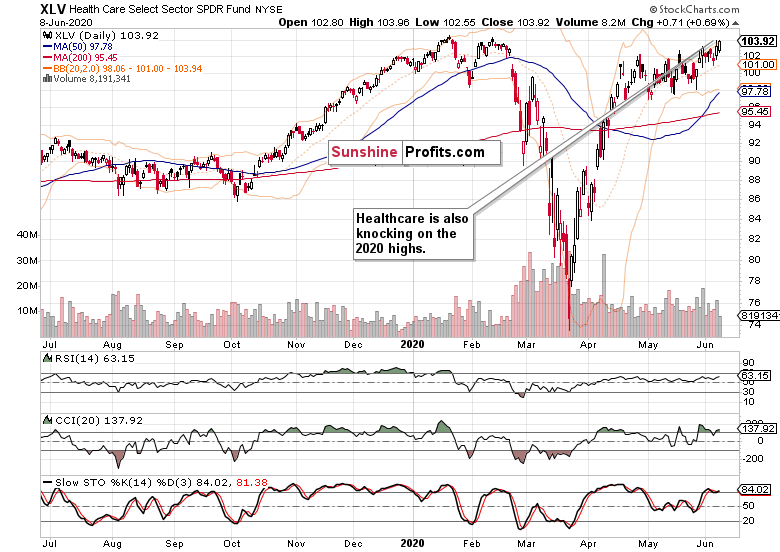
Healthcare (XLV ETF) is also getting ready to take on its February highs. And again it seems that overcoming them is merely a question of time.
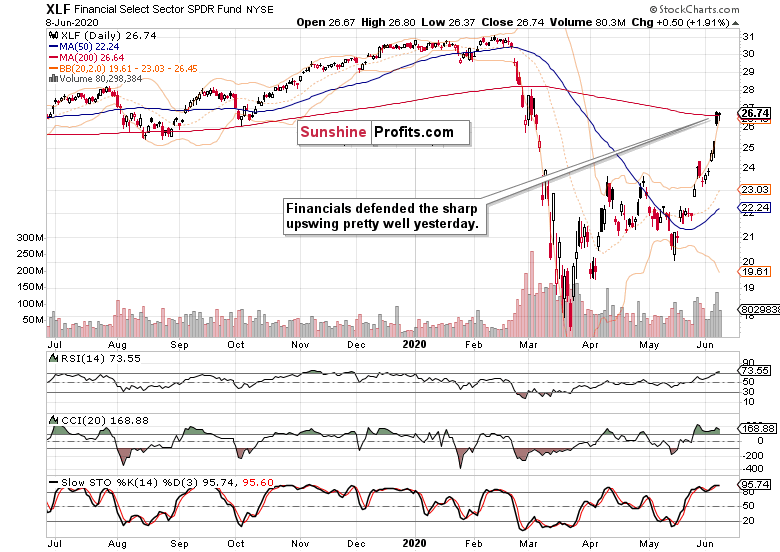
Financials (XLF ETF) held onto their gains from Monday pretty well. Don't be deceived by the black candles. The sector still managed to keep most of its bullish gap from yesterday intact. The daily volume shows that the sellers haven't really stepped in with force, meaning the unfolding upswing has a solid chance of extending gains after the unfolding and in all probability shallow S&P 500 correction is over.
he stealth bull market trio has done well yesterday. Energy (XLE (NYSE:XLE) ETF), materials (XLB ETF) and industrials (XLI ETF) have extended opening gains, which is bullish for the stock market advance. Unless we see them making a top, this bull market has much further to run.
And the bull is still very young, and the best is still ahead.
Summary
Summing up, stocks continue trading above the bearish wedge, and any downswing appears to be of temporary and rather shallow in nature. The weekly and daily charts highlight the bullish outlook, and credit markets, including Treasuries support the rotation into stocks with more buying power to come in from the sidelines. The sectoral performance remains conducive, and the strong showing of the early bull market trio (energy, materials and industrials) underscores that. So does the vigorous Russell 2000 (IWM ETF) performance or VIX no cause for concern? As the dollar remains under pressure and unlikely to stage more than a reflexive short-term bounce, stocks won't probably face a new deflationary headwind any time soon. Tomorrow's Fed won't likely change that, and I expect Friday's inflation numbers to be a cherry on the cake.
Coming full circle, the debt markets' performance is the key, and the rest broadly concurs with my bullish outlook.