I have been calling for a short-term stock market correction (see A time for caution) and my view remains unchanged. Intermediate term, however, equities look poised to move higher on cyclical strength. Let me explain.
Short-term cautious
In the wake of the recent kick-the-can-down-the-road resolution of the political impasse in Washington, I said to focus on the fundamentals that matter (see The sun will come out tomorrow):
- Earnings
- Macro outlook
- Fed outlook
What does that scorecard look like?
On the earnings front, the earnings and sales beat rate improved considerably this week. However, the rules of the Earnings Game have changed. Getting stock outperformance is less about finding companies that beat Street expectations, but knowing what they say about the outlook in the analyst conference call.
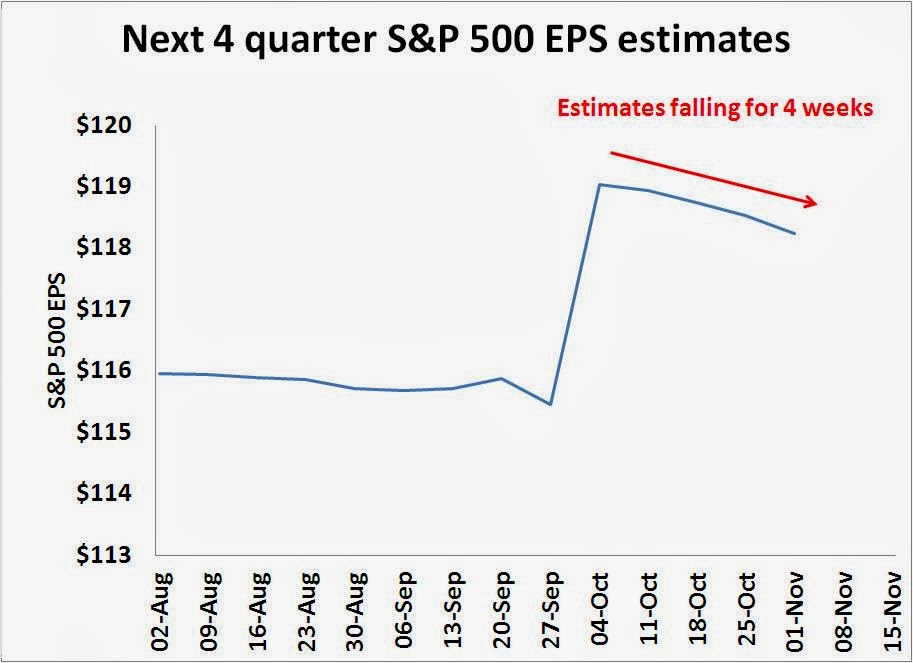
In addition to watching the earnings and sales beat rates and earnings guidance rates, I watch the evolution of the forward 4Q Street estimates more closely. Brian Gilmartin has done a superb job of reporting and analyzing Street estimates. The chart below shows how the forward 4Q estimates have changed since the beginning of August. They surged in late September to all-time highs, but they have been slowly deflating ever since in the past four weeks.
I would score the earnings dimension a slight negative.
At a macro level, the best news we saw last week were the blowout numbers exhibited by Chicago PMI and the beat by ISM Manufacturing. The astounding strength of the Chicago PMI was contradicted by the Markit manufacturing PMI, which was weaker. However, the Citigroup US Economic Surprise Index, which measures the beats and misses of high frequency economic releases, has been losing momentum.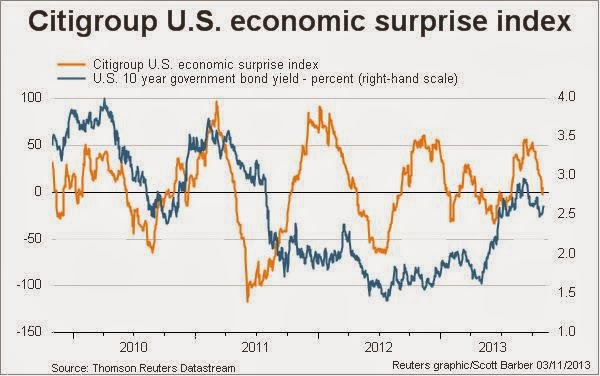
Call the economic dimension neutral, though arguably it could be slightly positive.
On the central banking front, the market did not take the FOMC statement well. Tim Duy thought that it was a bit on the hawkish side. The chart below (via Zero Hedge) shows how tapering expectations have evolved over the last few weeks.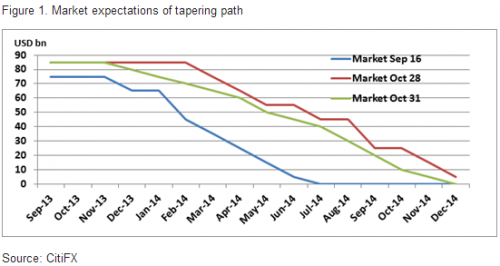
In addition to the shifting sands around tapering expectations, the Obama Administration has three governor vacancies to fill at the Federal Reserve. At this point, it is unclear what a Yellen Fed, if indeed it is a Yellen Fed, would look like as the other governors have not been named. At what point does the market focus on the composition of the Fed governor board? Score the monetary policy dimension slightly bearish - the market hates uncertainty.
Summing it all up, the three fundamental scores have deteriorated to roughly a neutral reading from slightly bullish in mid-October.
Technical and sentiment picture deteriorating
In addition, the short-term sentiment and technical pictures are deteriorating. Mark Hulbert recently pointed out that his NASDAQ timer index is at a crowded long reading. 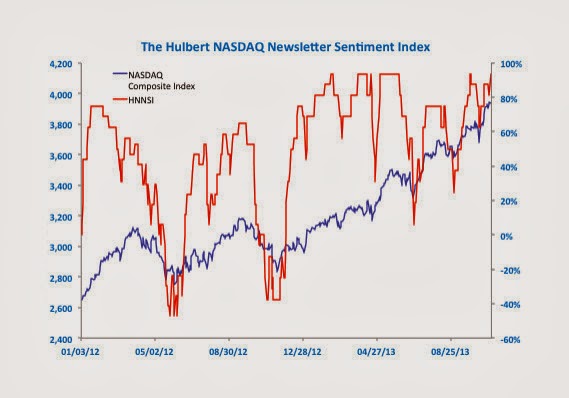
Hulbert went on to say that his studies show that the time horizon of this index as a contrarian indicator is shortening to about a month:
Upon subjecting the Hulbert Financial Digest’s three decades of historical sentiment data to rigorous econometric testing, I discovered that the sentiment data up until about 10 years ago had its greatest explanatory power at the three-month horizon. That’s a short enough horizon already, but it has shrunk in recent years — and is now little longer than one month.
Technically, there are a plethora of indicators that point to some equity market softness ahead. Market breadth continues to show a negative divergence, as evidenced by this chart of the SPX (top panel) and stocks above their 200 day moving average (bottom panel): 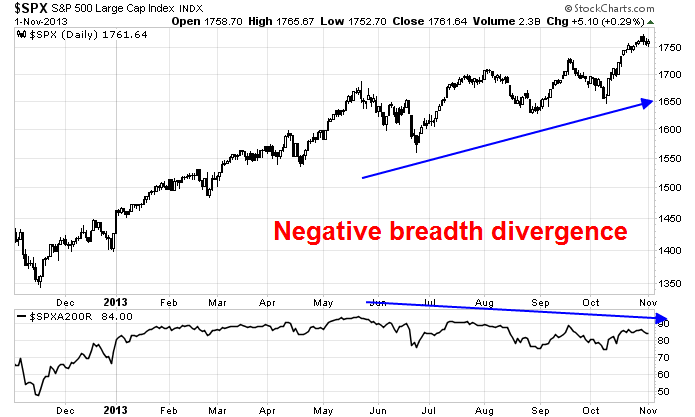
The relative performance of the high-beta small caps, which had been market leaders, has keeled over and violated a relative uptrend line:.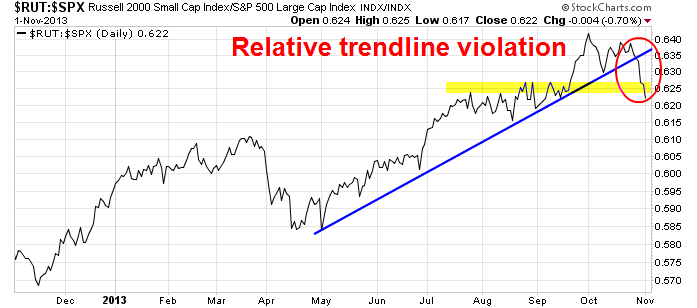
These aforementioned factors, along with the rising risk of a growth scare coming from China (see Watching for China-related volatility in November and The stakes are rising for China's Third Plenary), are reasons to believe that November is likely to be a little soft for equities.
Get ready for the Santa Claus rally?
Unless we get an ugly accident, e.g. very ugly Chinese developments or unexpected bout of Fed hawkishness, my base case continues to be a continuation of the stock market uptrend we have seen in 2013. That's because Mr. Market is still telling me that the US and possibly the global economy are undergoing a cyclical upturn.
Exhibit A is the relative performance of the Morgan Stanley Cyclical Index against the market, which remains in a solid relative uptrend. 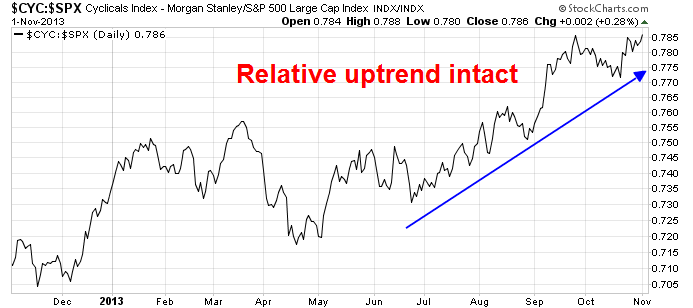
The positive relative performance of cyclical stocks is seen mainly in the relative performance of the capital goods heavy Industrial sector: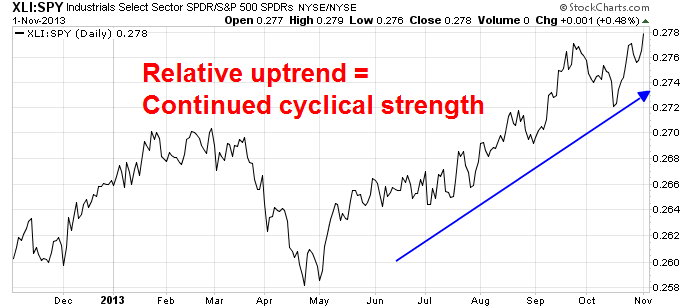
...and the Consumer Discretionary sector: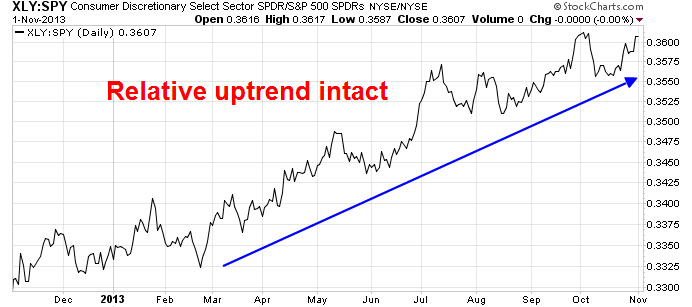
Surprisingly, the relative strength of cyclical stocks has not extended to deep cyclical sectors such as mining, possibly because of market caution over the outlook for Chinese growth.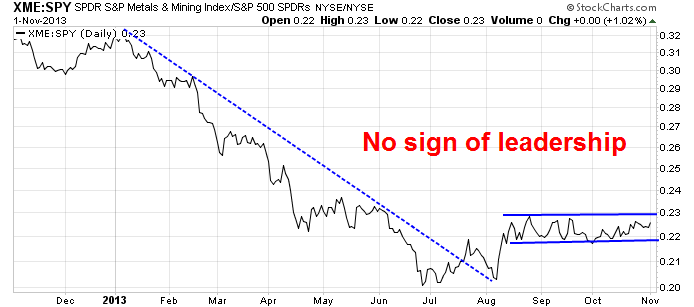
The sailing isn't all smooth ahead, however. The positive relative uptrends seen in the Industrial sector have not been confirmed outside the US. Non-US Industrial stocks recently staged a breach of a relative uptrend and appear to be undergoing a period of relative consolidation (note that these charts are all in USD so any currency effects are removed):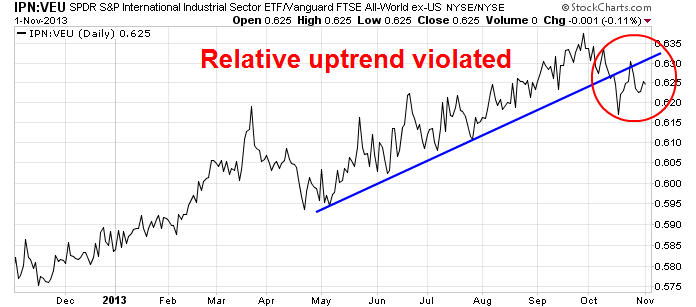
Similarly, the relative performance of Non-US Consumer Discretionary stocks exhibit a minor, but unconfirmed, violation of their relative uptrend: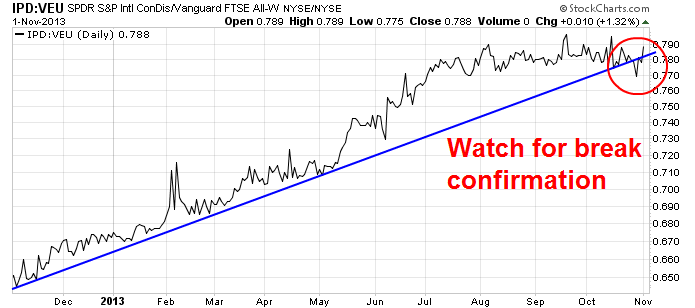
My main takeaway from studying these charts and indicators is that we are poised for a brief period of shallow weakness in equities. Barring any serious mishaps, stock investors should be positioned for a Santa Claus rally into year-end.
Disclosure: Cam Hui is a portfolio manager at Qwest Investment Fund Management Ltd. (“Qwest”). The opinions and any recommendations expressed in the blog are those of the author and do not reflect the opinions and recommendations of Qwest. Qwest reviews Mr. Hui’s blog to ensure it is connected with Mr. Hui’s obligation to deal fairly, honestly and in good faith with the blog’s readers.”
None of the information or opinions expressed in this blog constitutes a solicitation for the purchase or sale of any security or other instrument. Nothing in this blog constitutes investment advice and any recommendations that may be contained herein have not been based upon a consideration of the investment objectives, financial situation or particular needs of any specific recipient. Any purchase or sale activity in any securities or other instrument should be based upon your own analysis and conclusions. Past performance is not indicative of future results. Either Qwest or I may hold or control long or short positions in the securities or instruments mentioned.

