Get 40% Off
💰 Warren Buffett reveals a $6.72 billion stake in ChubbCopy Portfolios

Small-Cap Value, Liquidity Top US Equity Factor Returns In 2019

Published 02/28/2019, 06:51 AM
Updated 07/09/2023, 06:31 AM
SPY
-
IJS
-
USMV
-
MTUM
-
VFLQ
-

US stocks in the small-cap value bucket continue to lead the performance list for the major equity factors for year-to-date results (through Feb. 27), based on a set of exchange-traded funds. In close pursuit is the so-called liquidity factor, which is currently the second-strongest performer this year.

The iShares S&P Small-Cap 600 Value (NYSE:IJS) is currently posting the best year-to-date factor gain. IJS is ahead 17.5% so far in 2019, modestly above the second-best return: a 16.6% rise for Vanguard US Liquidity Factor (NYSE:VFLQ), which favors companies that exhibit relatively low levels of trading liquidity.

Note that all the major equity factor buckets are posting gains so far this year. The softest advance is a 9.4% return for iShares Edge MSCI Minimum Volatility USA (NYSE:USMV). The second-lowest performer: iShares Edge MSCI USA Momentum (NYSE:MTUM), which is up 9.8%.

Across-the-board gains for US equity factors is no surprise when you consider that the broad stock market is posting a solid year-to-date return. SPDR S&P 500 (NYSE:SPY), a widely followed proxy for US equities overall, is up a strong 11.7%. The broad equity beta’s influence, in other words, is no trivial factor this year.
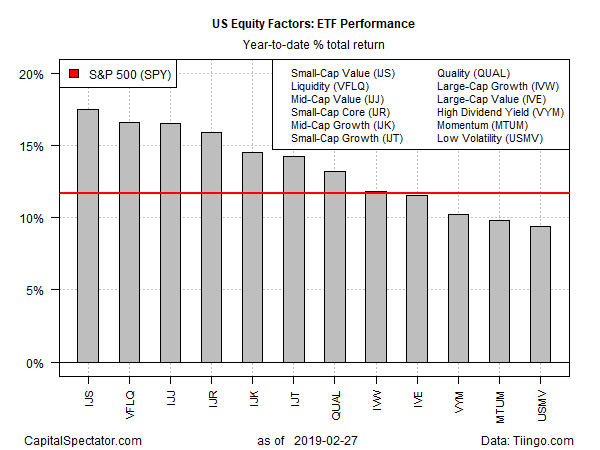
US Equity Factors : ETF Performance

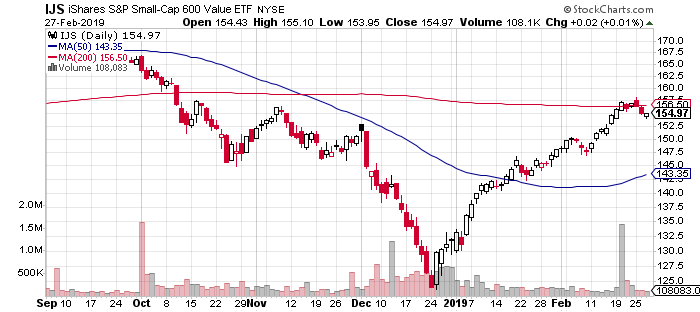
Focusing on the technical profile of the factor ETFs shows that all the funds are currently trading above their 50-day averages, a performance that marks a reversal from the weak results in late-2018. A typical example can be found in this year’s strong rebound in iShares S&P Small-Cap 600 Value (NYSE:IJS), as shown in the chart below.
3rd party Ad. Not an offer or recommendation by Investing.com. See disclosure here or remove ads .

IJS Daily Chart

Although the 2019 revival in factor ETF prices has been impressive, one widely monitored hurdle has yet to be reached: a rise in the 50-day average above the 200-day average. For now, this technical profile for all the factor ETFs listed above continues to reflect a 50-day average that’s below the 200-day average. Ditto for SPY, the broad market ETF proxy. Until the 50-day average rises above its 200-day counterpart, some analysts cite this as a reason to remain cautious on assessing the prospects for a continuation in this year’s rally.

Latest comments

Risk Disclosure: Trading in financial instruments and/or cryptocurrencies involves high risks including the risk of losing some, or all, of your investment amount, and may not be suitable for all investors. Prices of cryptocurrencies are extremely volatile and may be affected by external factors such as financial, regulatory or political events. Trading on margin increases the financial risks.
Before deciding to trade in financial instrument or cryptocurrencies you should be fully informed of the risks and costs associated with trading the financial markets, carefully consider your investment objectives, level of experience, and risk appetite, and seek professional advice where needed.
Fusion Media would like to remind you that the data contained in this website is not necessarily real-time nor accurate. The data and prices on the website are not necessarily provided by any market or exchange, but may be provided by market makers, and so prices may not be accurate and may differ from the actual price at any given market, meaning prices are indicative and not appropriate for trading purposes. Fusion Media and any provider of the data contained in this website will not accept liability for any loss or damage as a result of your trading, or your reliance on the information contained within this website.
It is prohibited to use, store, reproduce, display, modify, transmit or distribute the data contained in this website without the explicit prior written permission of Fusion Media and/or the data provider. All intellectual property rights are reserved by the providers and/or the exchange providing the data contained in this website.
Fusion Media may be compensated by the advertisers that appear on the website, based on your interaction with the advertisements or advertisers.
© 2007-2024 - Fusion Media Limited. All Rights Reserved.