This article was written exclusively for Investing.com
Small-cap stocks have soared since Sept. 24, with the iShares Russell 2000 ETF (IWM) soaring by more than 13%. However, signs are emerging that the big rally may be about to come to an abrupt end. It could result in the ETF dropping by as much as 8% from its price on Oct. 8 of around $161.85.
The sector has been on the rise as investors grow optimistic that another relief package from Washington will help to boost the beaten-down US economy. Small caps, airlines, and consumer sectors are the most likely to benefit from another relief bill. But to this point, neither the Republicans nor the Democrats have agreed on a package.
Betting on A Sharp Decline
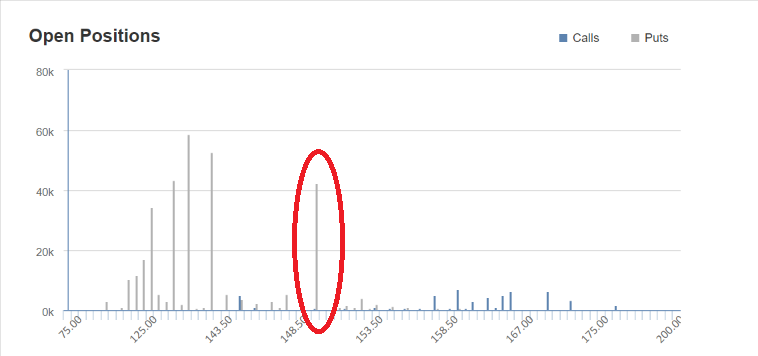
The bleak outlook on landing a deal could be pushing traders to bet on a significant pullback in the ETF. The open interest for the Oct. 30 $150 puts rose by over 31,000 contracts on Oct. 7. The data shows the puts were bought for about $1.70 per contract. It would imply that the IWM is trading around $148 by the end of October, a decline of about 8%. The trader paid about $5.2 million in premiums to create the bearish bet.
There was another sizeable bearish bet on the IWM, with the open interest rising by over 17,000 on Oct. 8 for the Nov. 20 $153 puts. In this case, the puts were bought for about $4.50 per contract. It also implies that the IWM is trading below $149 by the middle of November. In this case, the trader paid about $7.9 million in premiums.

Chart courtesy of Investing.com
Too Far, Too Fast
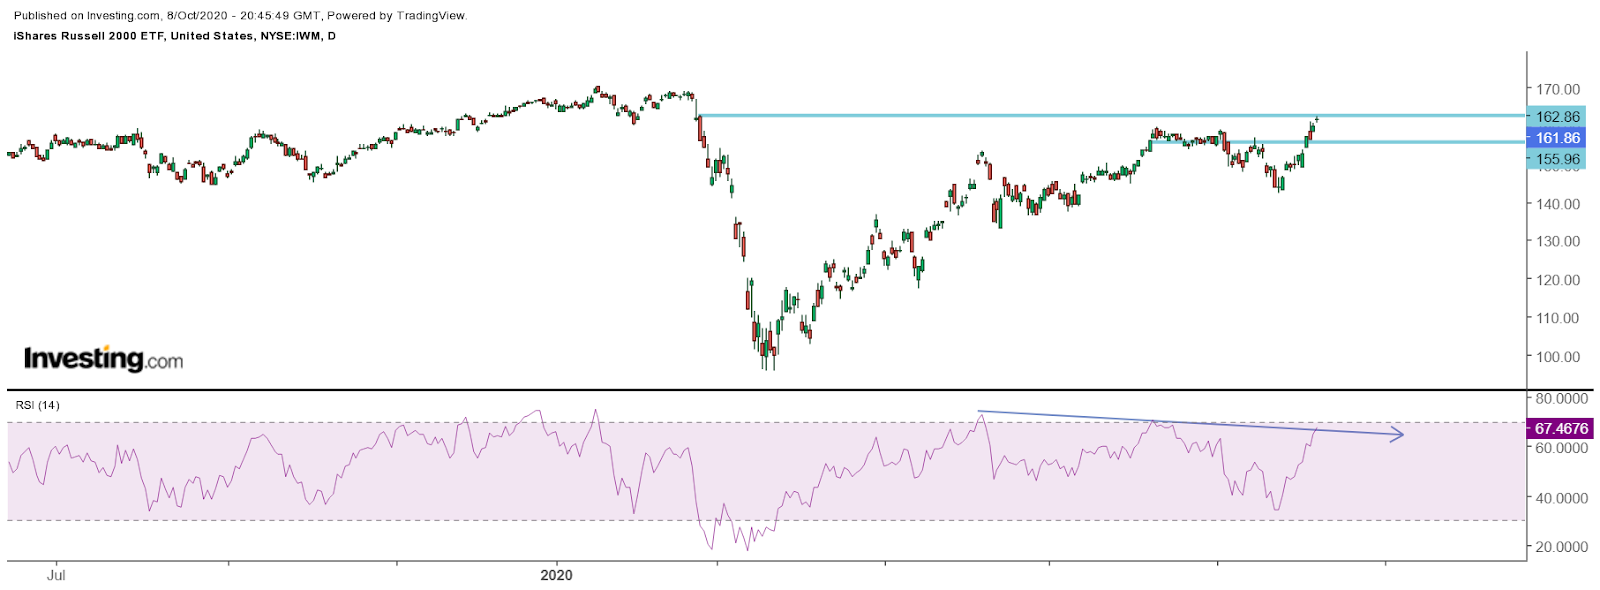
The traders may also be betting that the sector has merely rallied too far, too fast. The IWM has seen its relative strength index climb to nearly 70, hitting overbought levels. Additionally, the RSI has been making lower highs, despite prices making higher highs. This is likely creating a bearish divergence, an indication that the IWM is likely to head lower.
Further, the ETF is trading around a significant level of technical resistance near 162. The last time the ETF was at this level was in February. Should the ETF fail to push through that level of resistance, it is likely to result in it declining to around $156, a drop of 3.1%

A Deal May Be Hard to Come By
The big rally has been on the heels of the on-again, off-again relief bill that has been floated in Congress. However, to this point, both sides have been unable to agree on a plan of action. It also appears that the two sides are very far apart in the amount of money each wants to put towards a bill, and how it should be spent. Should Congress not come through on a relief bill, it could pose a severe threat to the big rally witnessed in the small-cap sector.
It leaves the sector vulnerable to plenty of volatility over the short-term as investors hold their collective breath.
