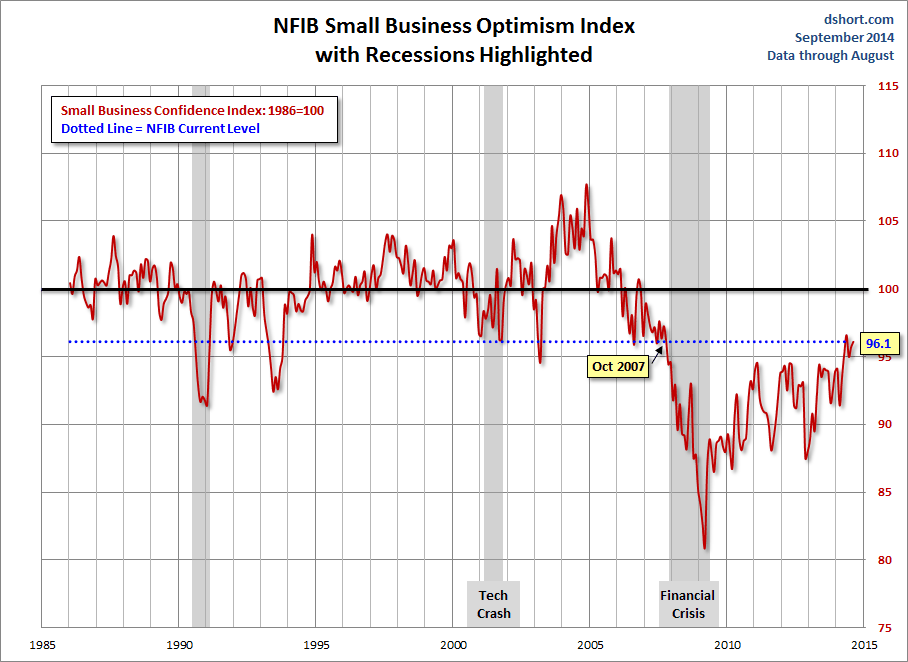
The latest issue of the NFIB Small Business Economic Trends is out today. The September update for August came in at 96.1, a 0.4 point uptick from the previous month's 95.7. In characteristic style, today's report subtitle downplays the improvement: "Expectations glum in 0.4-point increase to 96.1 in August". The index is now at the 29th percentile in this series, slightly below its post-recession 96.6 high in May and back to a level it last consistently achieved in October 2007, two months before the last recession.
The Investing.com forecast was for 95.9.
Here is the opening summary of the news release.
August’s Optimism Index rose 0.4 points to 96.1 making it the second highest reading since October, 2007. The four “hard” measures (job creation plans, job openings, capital spending plans and inventory investment plans) were collectively unchanged, and the other 6 components added to the Index a bit to produce a modest gain. (Link to press release).
The first chart below highlights the 1986 baseline level of 100 and includes some labels to help us visualize that dramatic change in small-business sentiment that accompanied the Great Financial Crisis. Compare, for example the relative resilience of the index during the 2000-2003 collapse of the Tech Bubble with the far weaker readings of the past four years. The NBER declared June 2009 as the official end of the last recession.
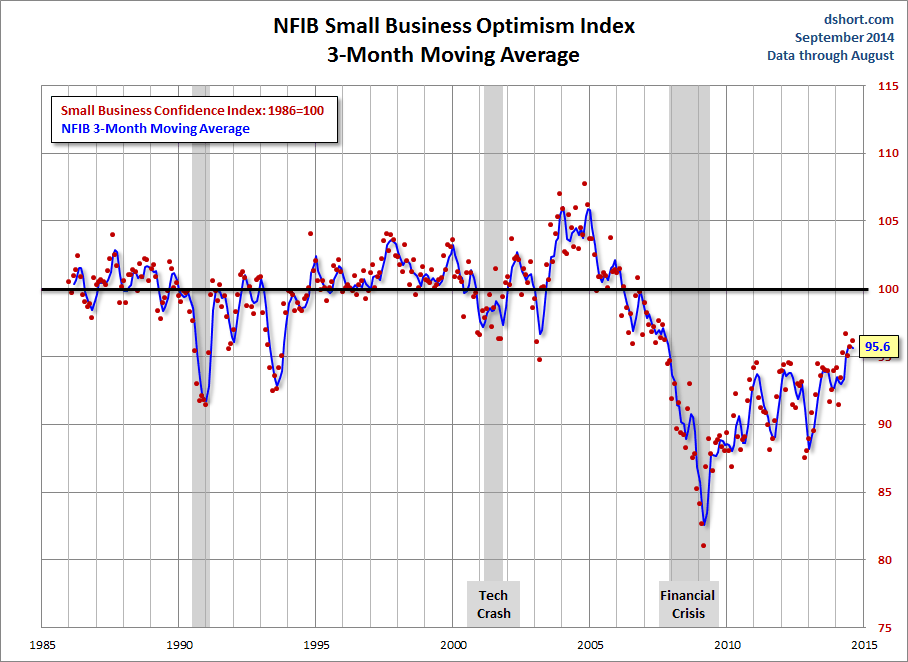
The average monthly change in this indicator is 1.3 points. To smooth out the noise of volatility, here is a 3-month moving average of the Optimism Index along with the monthly values, shown as dots.
The latest findings show that "xpected real sales volumes posted a 4 point decline, falling to a net 6 percent of owners expecting gains." The excerpts below are from the latest monthly report (PDF format).
| The pace of inventory reduction improved 1 point, with a net negative 2 percent of all owners reporting growth in inventories (seasonally adjusted). So, on balance, more firms are reducing inventory than building stocks. The net percent of owners viewing current inventory stocks as “too low” improved 1 point to a net negative 2 percent. Sales trends continued to deteriorate a bit but remained near the best levels in the recovery, just historically weak. The net percent of owners planning to add to inventory stocks rose 1 point to a net 1 percent. While inventories have been building solidly at the national level, it appears that the small business sector is adding little to the accumulation of stocks. |
Credit Markets
Has the Fed's zero interest rate policy and quantitative easing had a positive impact on Small Businesses?
| Four percent of the owners reported that all their credit needs were not met, equal to the record low. Twenty-eight percent reported all credit needs met, and a record high 55 percent explicitly said they did not want a loan. Only 2 percent reported that financing was their top business problem compared to 24 percent citing taxes, 19 percent citing regulations and red tape and 13 percent citing weak sales. The net percent of owners expecting credit conditions to ease in the coming months was a seasonally adjusted negative 5 percent; more owners expect that it will be “harder” to arrange financing than easier. This is the most favorable reading about credit market conditions since 2006, occurring at a time when the Federal Reserve is terminating its aggressive QE3 policy. Interest rates are low, but prospects for putting borrowed money profitably to work are not great and so loan demand remains weak among small business owners. |
NFIB Commentary
This month's "Commentary" section opens with the following observations:
| The good news, no recession signal. The bad news, no expansion signal. The NFIB Optimism Index was steady at the high end of its fairly narrow tunnel of moderately poor performances. A persistent up-trend in reported increases in average selling prices snapped, probably in response to unexpectedly weak consumer spending. Capital spending showed a bit more life, along with a hike in plans to continue it. But employment indicators were flat. Job openings increased, anticipating a lower unemployment rate but not more jobs as job creation plans faltered. There just wasn’t a lot of good GDP news in the numbers, just a “more of the same” picture. |
Business Optimism and Consumer Confidence
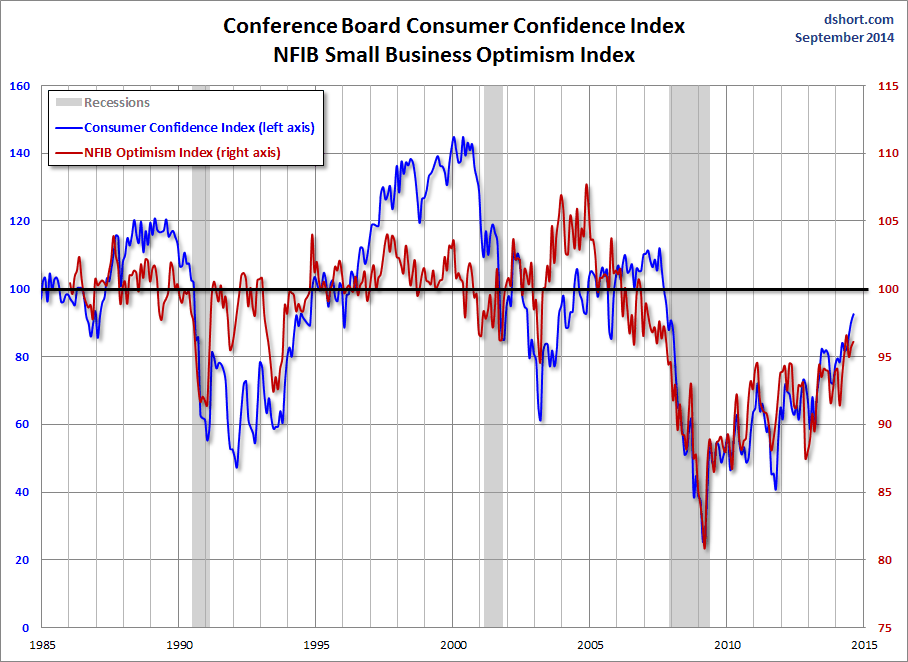
The next chart is an overlay of the Business Optimism Index and the Conference Board Consumer Confidence Index. The consumer measure is the more volatile of the two, so I've plotted it on a separate axis to give a better comparison of the volatility from the common baseline of 100.

These two measures of mood have been highly correlated since the early days of the Great Recession.


