The markets get off to a slow start ahead of what could be an eventful week with the FOMC meeting due on Wednesday. The US dollar was seen edging higher on Friday but only posted modest gains as investors brace for the Fed meeting this week.
On the economic front, data from the US was somewhat mixed. Housing starts were seen rising at a slower pace of just 1.24 million compared to 1.33 million the month before. Building permits were somewhat better, rising 1.30 million. Industrial production figures released on Friday surged 1.1% beating estimates of 0.3% and reversing the revised 0.3% declines from the month before.
Data from the eurozone showed that headline consumer prices rose only 1.1% missing estimates of 1.2% increase.
Looking ahead, Italy's industrial production and trade balance figures are coming up today amid a quiet trading day. The G-20 meetings are due. Other major factors coming up include the Brexit talks due on 22 March where Britain is hoping to clinch a transitory deal.
EUR/USD intra-day analysis

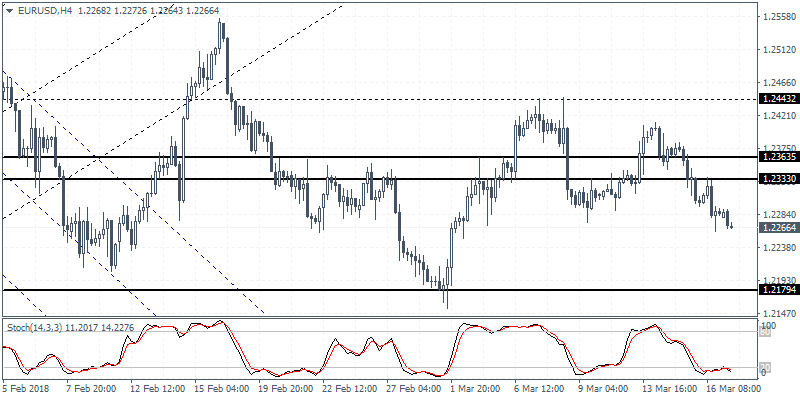
EUR/USD (1.2266): The EUR/USD was seen posting modest declines on Friday led by weaker than expected consumer prices. With the recent ECB speech from Draghi at the ECB Watchers conference, the central bank is expected to maintain a slow and steady pace when it comes to tapering. The ranging price action in EUR/USD continues to play out with last week seeing the euro currency falling below the support zone of 1.2635 - 1.2333 area. We expect to see this level being re-tested once again for resistance while to the downside, the common currency could be seen extending the declines to 1.2179 level of support.
GBP/USD intra-dayanalysis

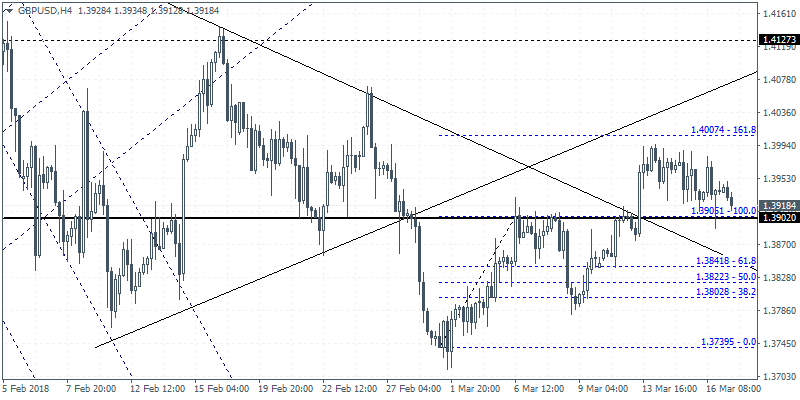
GBP/USD (1.3918): The British pound closed on Friday with the doji but price action was supported above the 1.3902 level of support. Although price action has failed to post any big gains above this level we expect the consolidation to continue in the short term. Any near-term dips could send the British pound to retest the 1.3902 level while to the upside the price area of 1.4000 could potentially be tested following the breakout after the bullish ascending triangle pattern.
XAU/USD intra-day analysis

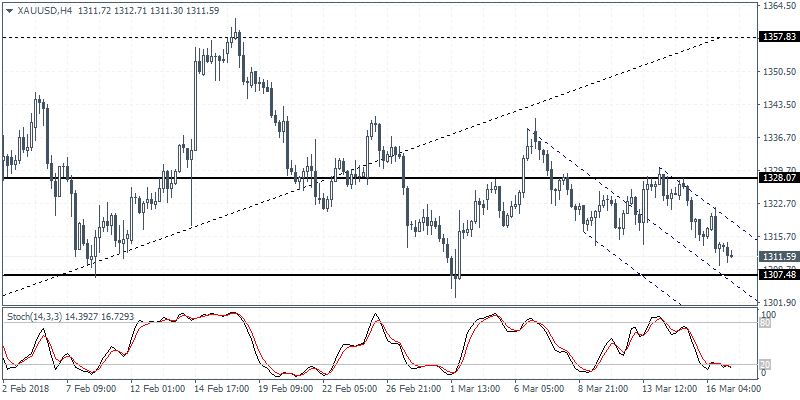
XAU/USD (1311.59): Gold prices were also seen closing the week lower but overall, the trend remains supported above 1307. Only a breakdown below this level could signal further declines toward 1282 - 1274 region. In the near term, the 4-hour chart shows a possible retest toward 1318 - 1317 level where short term resistance could be established. A reversal at this level could confirm the downside bias in gold targeting 1307 and eventually to the 1282 level of support.
