Get 40% Off
👀 👁 🧿 All eyes on Biogen, up +4,56% after posting earnings. Our AI picked it in March 2024.
Which stocks will surge next?
Unlock AI-picked Stocks

Silver: Bullish Or Bearish?

Published 01/25/2017, 07:47 AM
Updated 07/09/2023, 06:32 AM

Here is what I said about silver on 18th January, 2017. Here is one chart from that article:
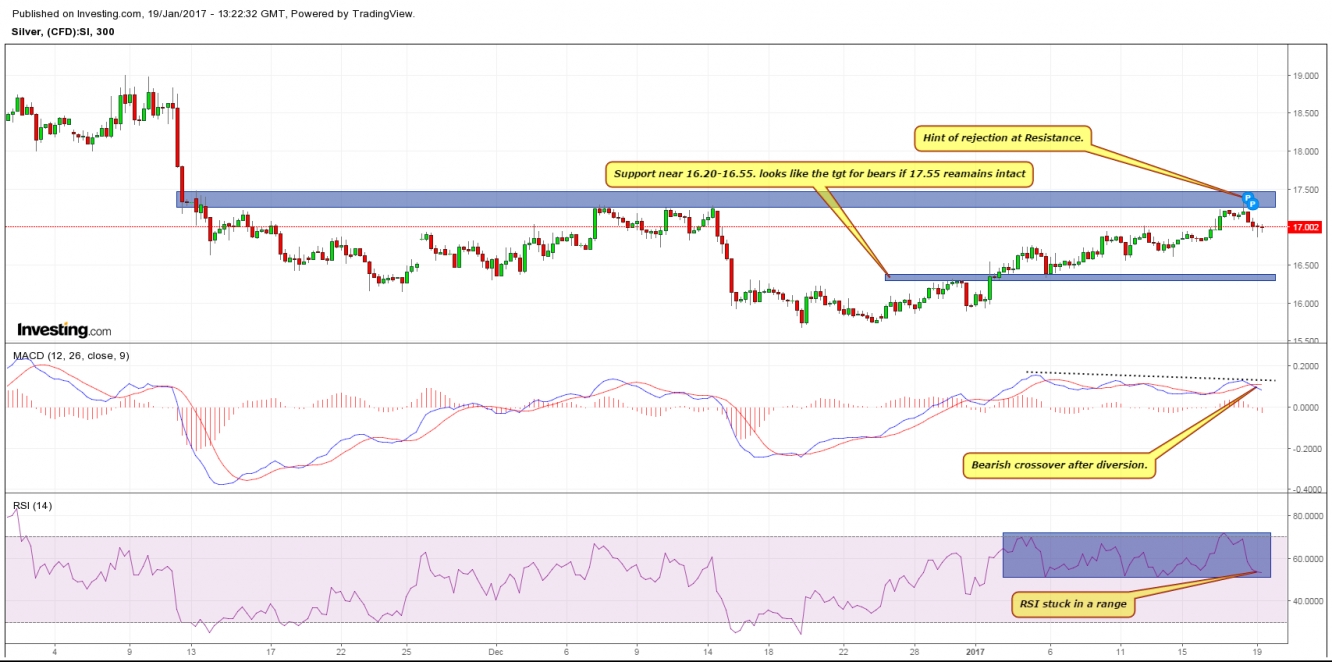
Silver 5 Hour Chart

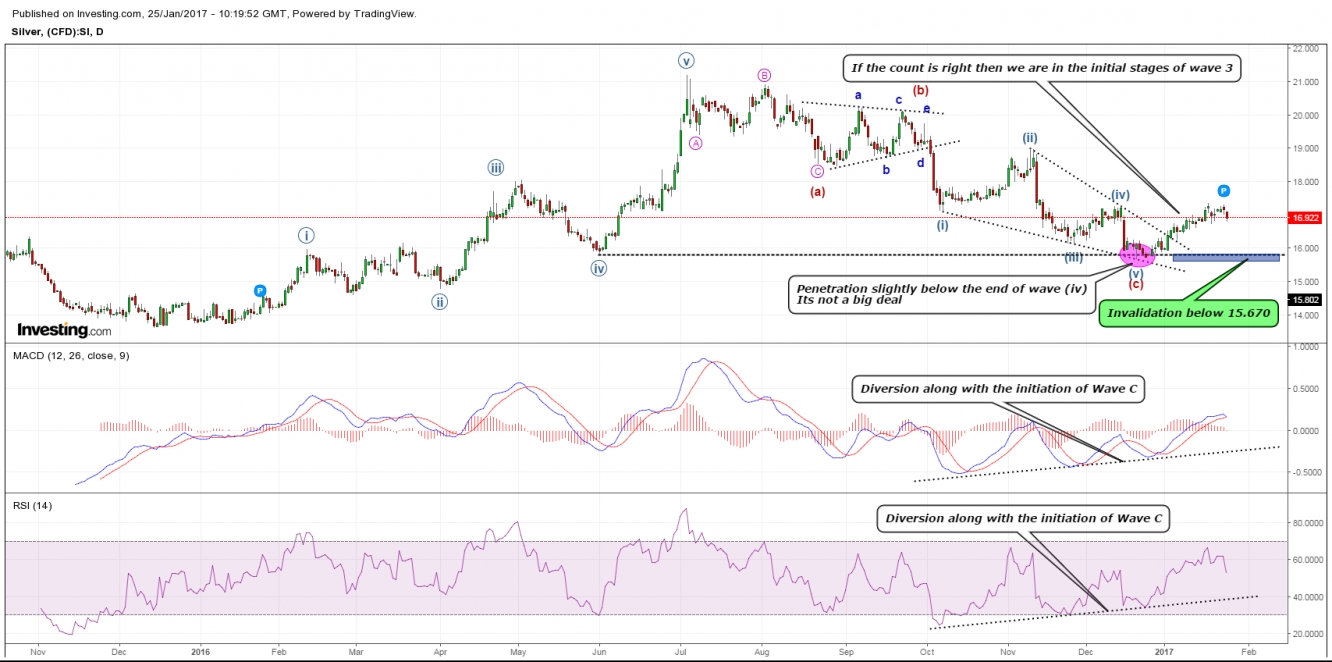
Let's start with the daily chart of silver:
Silver Daily Chart

I have shown my preferred wave count in this chart and to make it very simple, I have indicated only the larger degreee counts and smaller one left alone. It very much looks like a classical chart indicated in textbooks.

Correction in ABC finished just below the end of wave (iv) (just according to me, others may have a different look at the same chart). Diversion started from the beginning of wave C. No full wave C is in the form of ending diagonal. If I am right, we started to move higher from the condition of extreme pessimism for the bullion, where everyone just wanted to short this white giant. Silver just cleared the first resistance of 17.35 (minimum requirement for the first wave) in it's so-called wave 1 of wave (III).

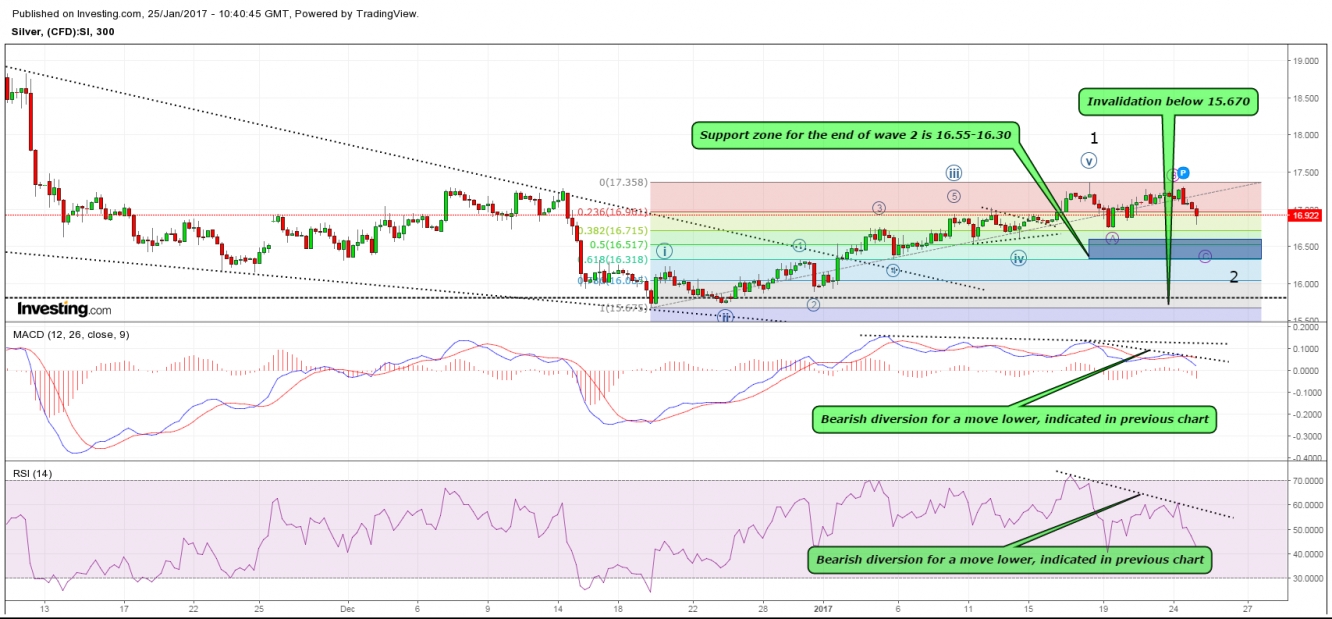
Let's move to the lower timeframe for insight. Here is the 5 hour chart of silver below with insight of wave 1 of (III):
Silver 5 Hour Chart

Silver moved up to clear the first resistance of 17.35 in 5 waves and now it is under ABC correction for wave 2. In this course of correction, silver has also developed a smaller asymmetrical double top in which most the short term traders would be interested.

Ideally, wave 2 should end in the area of wave 4 of one lower degree or betweeen 50-61.80% retracement value of entire wave 1 which comes under 16.55-16.30 (indicated by blue box for support of wave 2).

3rd party Ad. Not an offer or recommendation by Investing.com. See disclosure here or remove ads .

We would be keenly intererested in buying the white giant in this area with invalidation zone below 15.67. I am bullish in this metal complex. The rest is up to the market to prove whether I am right or wrong about the upcoming speculative directional move.

Resistance: 17.35/17.50/17.80
Support : 16.55/16.30/15.675

Latest comments

Risk Disclosure: Trading in financial instruments and/or cryptocurrencies involves high risks including the risk of losing some, or all, of your investment amount, and may not be suitable for all investors. Prices of cryptocurrencies are extremely volatile and may be affected by external factors such as financial, regulatory or political events. Trading on margin increases the financial risks.
Before deciding to trade in financial instrument or cryptocurrencies you should be fully informed of the risks and costs associated with trading the financial markets, carefully consider your investment objectives, level of experience, and risk appetite, and seek professional advice where needed.
Fusion Media would like to remind you that the data contained in this website is not necessarily real-time nor accurate. The data and prices on the website are not necessarily provided by any market or exchange, but may be provided by market makers, and so prices may not be accurate and may differ from the actual price at any given market, meaning prices are indicative and not appropriate for trading purposes. Fusion Media and any provider of the data contained in this website will not accept liability for any loss or damage as a result of your trading, or your reliance on the information contained within this website.
It is prohibited to use, store, reproduce, display, modify, transmit or distribute the data contained in this website without the explicit prior written permission of Fusion Media and/or the data provider. All intellectual property rights are reserved by the providers and/or the exchange providing the data contained in this website.
Fusion Media may be compensated by the advertisers that appear on the website, based on your interaction with the advertisements or advertisers.
© 2007-2024 - Fusion Media Limited. All Rights Reserved.