The US Federal Reserve’s decision not to taper Qualitative Easing was no surprise to some analysts. As Patrick Montesdeoca has discussed before with Rick Rule, President of Sprott Asset Management USA, and he reiterated in a recent interview, QE is not a program to add liquidity. There is plenty of liquidity in the markets. Rule said, “The federal government is spending $1.2 trillion per year more then it takes in.” The government can borrow about half of that amount, but to get the other half, it has to create it. QE is a means to create the money needed to cover the difference between government income and spending. Or, as Mr. Rule said, and I agree, “It is counterfeit, plain and simple.”
The mainstream media has spent a great deal of time on the current debt ceiling impasse. Mr. Rule believes that the politicians will find a way to agree to raise the debt ceiling for the simple reason that if they do not, they will have to significantly cut spending. As Mr. Rule said, “They will find a way to continue to perpetrate this fraud, and find a way through it. There are some concrete spending measures they could take, but if they save money in one column, it’s already spent in several other columns.”
In my last post, I speculated there would possibly be some further weakness in the silver market. I am using this continued weakness to add to my long term holdings given the strong fundamentals supporting the market. Despite the fact I am a silver and gold bug, I am not always bullish on the shorter term time frames and it doesn’t mean that I will buy at any price. That is why I am writing these reports to help those of you who are buying gold and silver to be patient and learn to buy when it makes sense. The key point here is that both technical analysis and fundamental analysis have to match up. This is where indicators like The VC Price Momentum Indicator can come in handy.
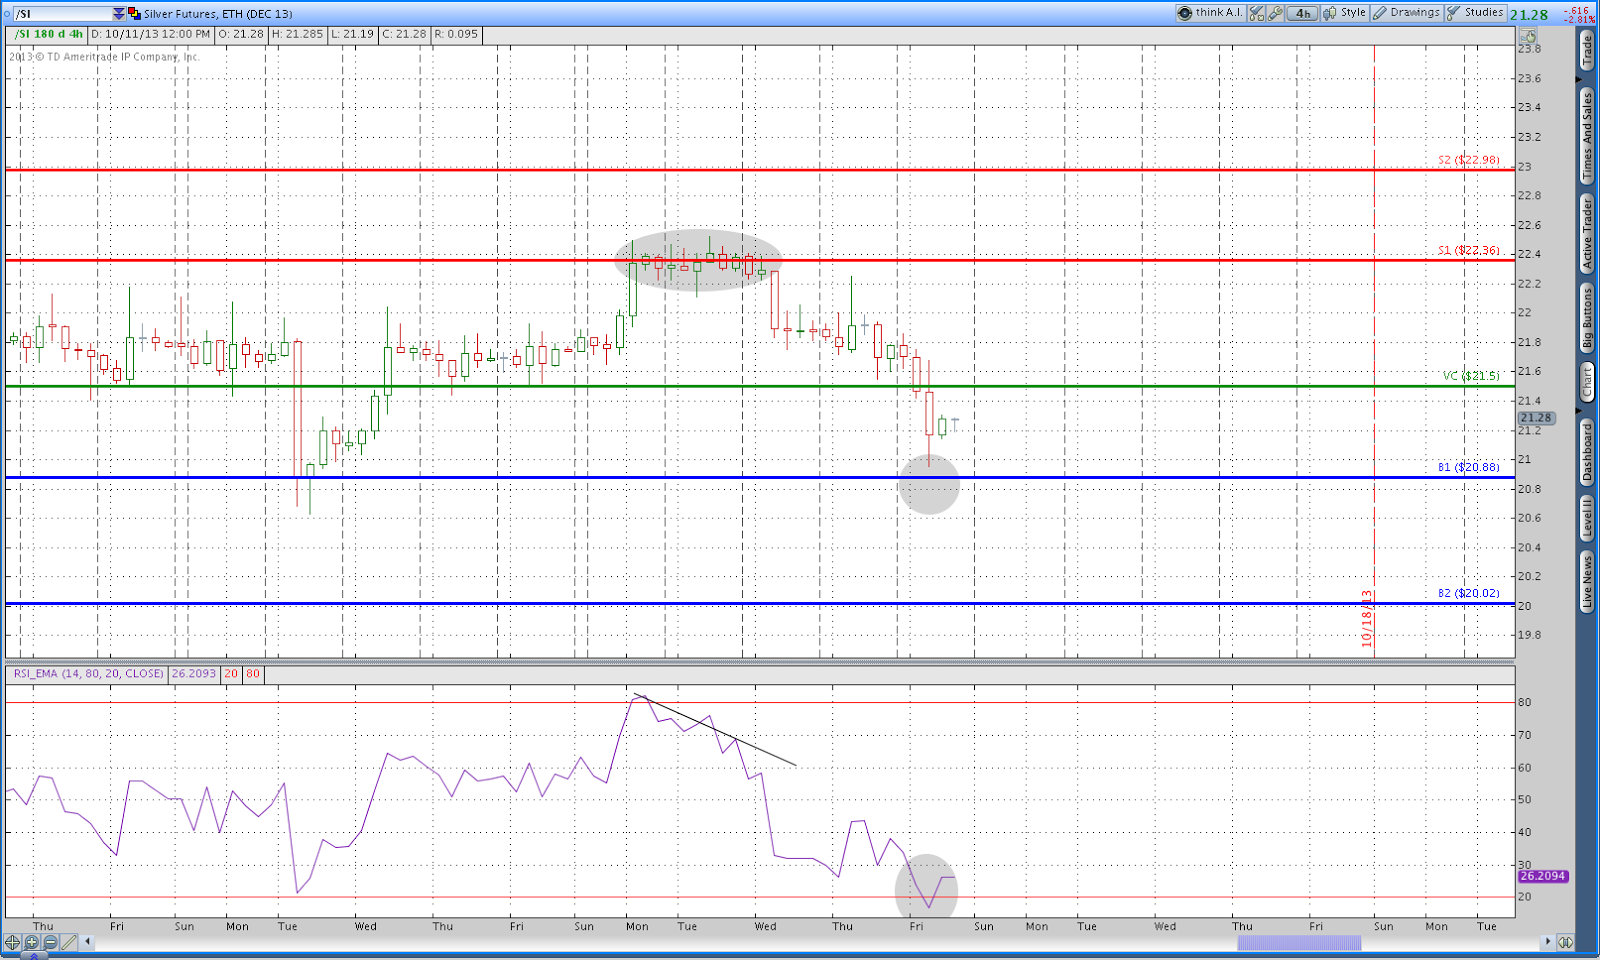
Chart 1 is the Weekly VC chart. These numbers are generated before the week begins and can improve your entry points into the gold and silver markets with uncanny accuracy. Throughout the week the S1 level (which is the first red line) served as key resistance in the silver market. If you were long with your swing trades on shorter term time frames this would have been an ideal place to take profits. Today support has come in around the B1 line (the first Green line) which would serve as support going into the weekly close. This would be a great time to add to any current positions or take a short term trade. Notice how the RSI was in oversold conditions as soon as we touched the B1 line. Based off these charts, I would be expecting a quick bounce the beginning of next week; however, the shorter term trends still remains sideways as noted on Charts 2 & 3.
Chart 1
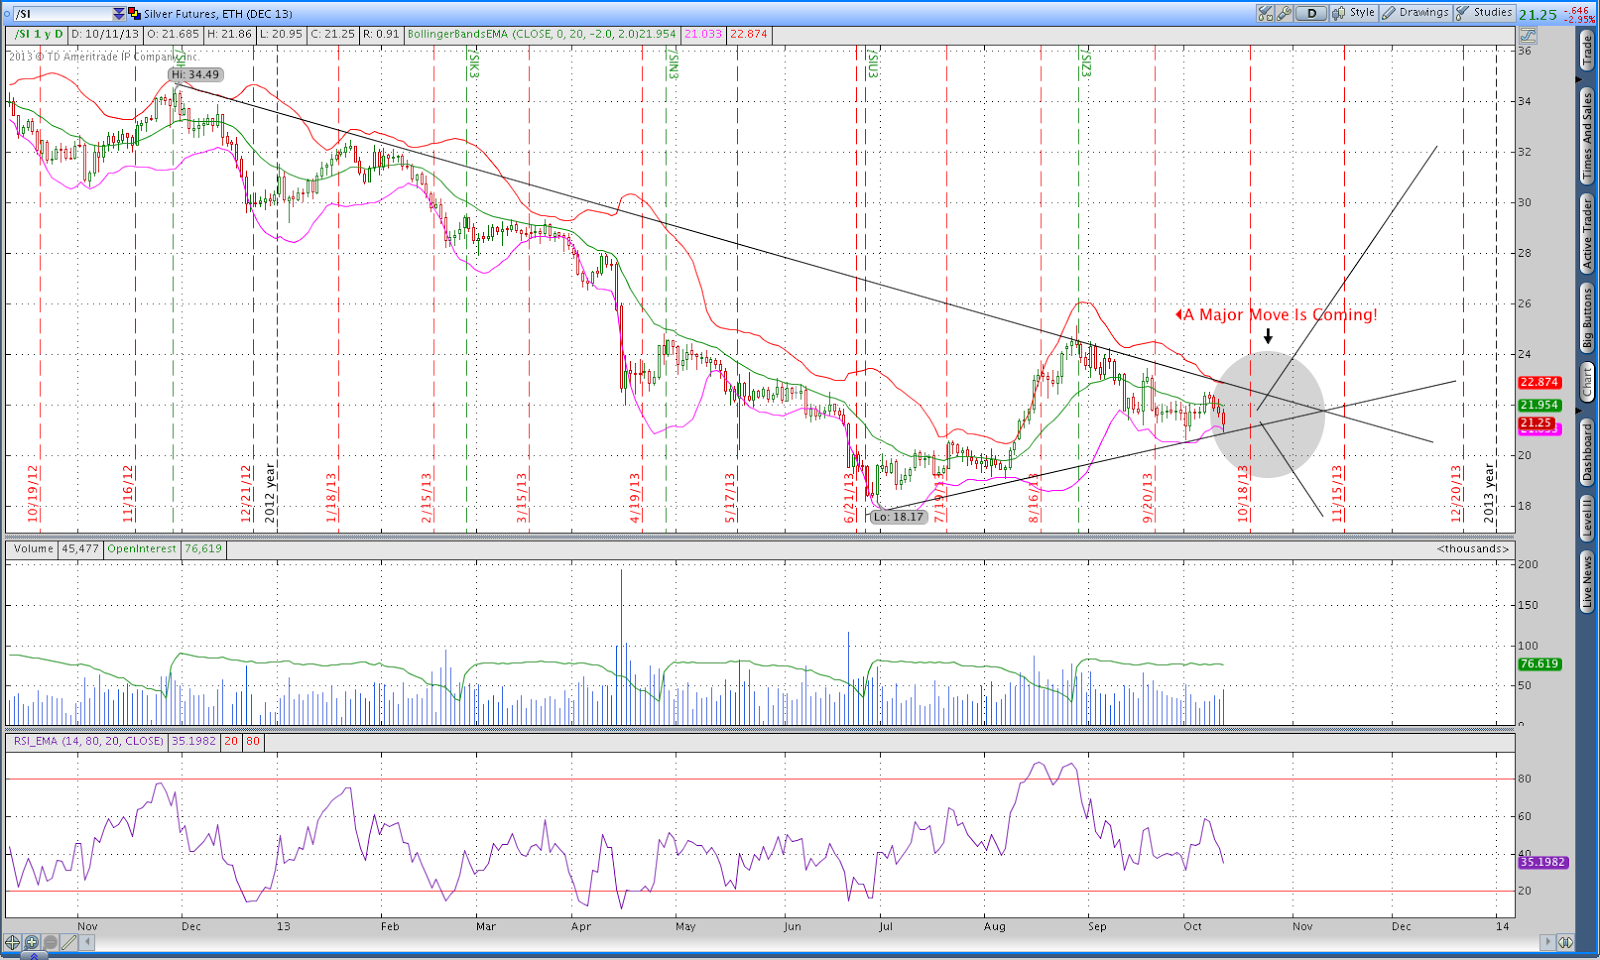
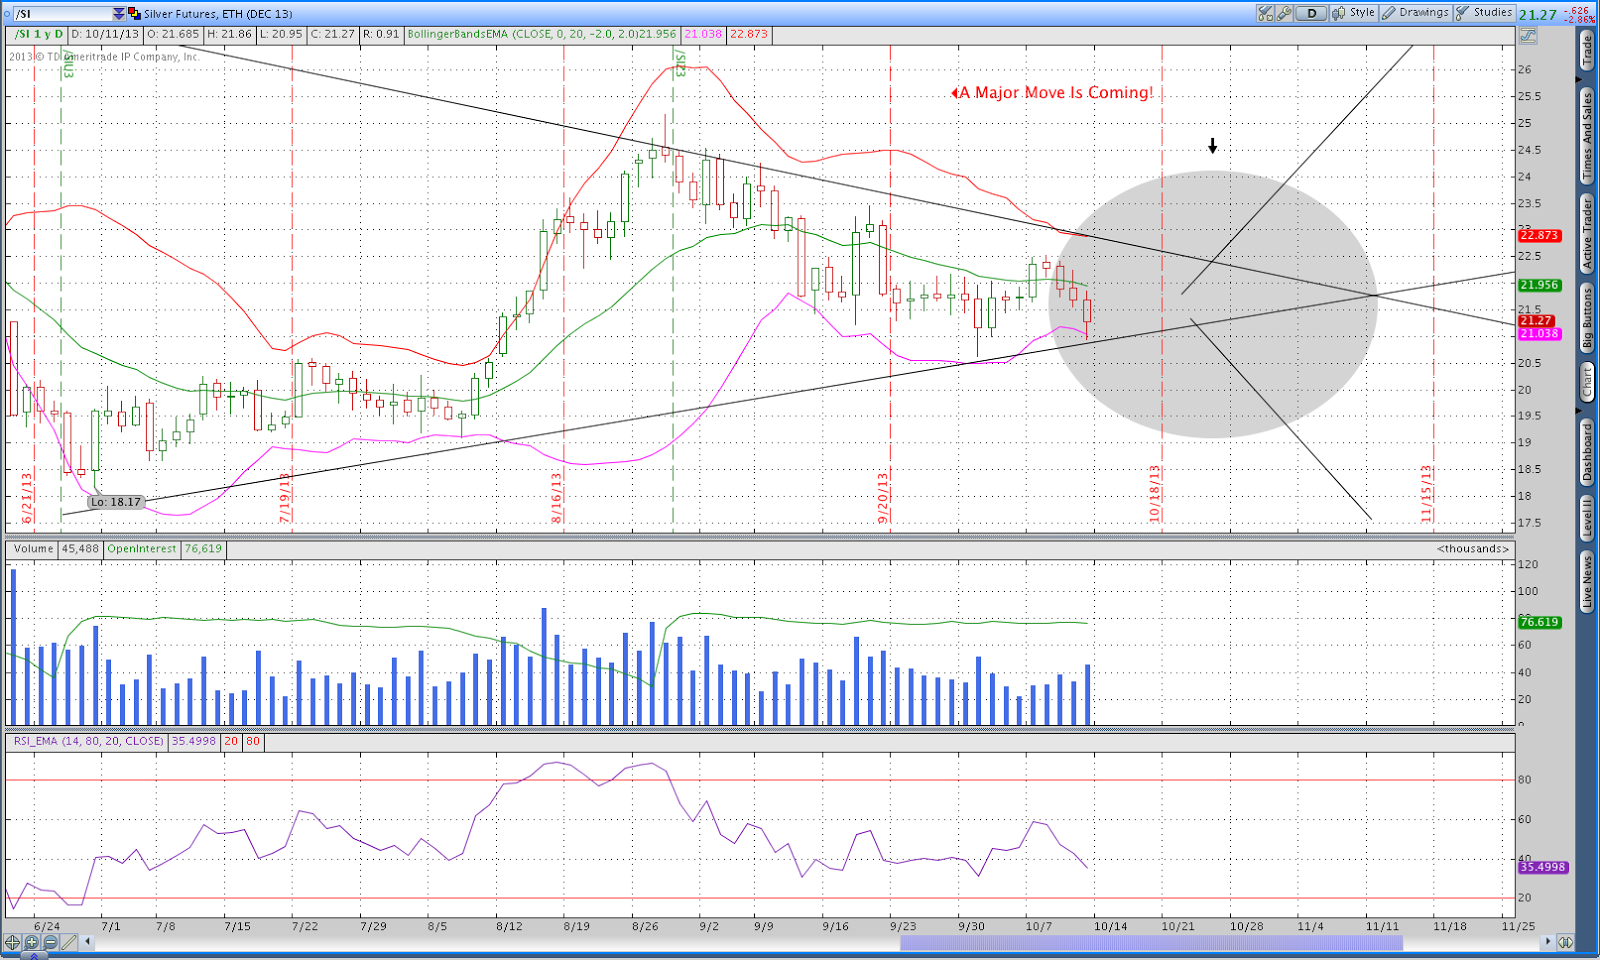
Charts 2 and 3 clearly show the long term trend line from $34/oz. silver back in December 2012. We have yet to clear this trend line and it is quickly meeting up with an intermediate term trend line from the recent lows at $18/oz. Fundamentals put aside, these competing trend lines have been leading to our sideways to lower price action since August. It looks as if we should have a resolution by the end of October or early November. From this a major move should occur establishing a strong trend in either direction. I am expecting the next move to be up, but I do not plan on being the silver “bug” that gets squashed. So as a precautionary, I will be hedging my long position using “puts”. If I am right and the move is to the upside, we could quickly see a retest of $26/ ounce. I have writing about this for several months now. (posts)
Chart 2

- English (UK)
- English (India)
- English (Canada)
- English (Australia)
- English (South Africa)
- English (Philippines)
- English (Nigeria)
- Deutsch
- Español (España)
- Español (México)
- Français
- Italiano
- Nederlands
- Português (Portugal)
- Polski
- Português (Brasil)
- Русский
- Türkçe
- العربية
- Ελληνικά
- Svenska
- Suomi
- עברית
- 日本語
- 한국어
- 简体中文
- 繁體中文
- Bahasa Indonesia
- Bahasa Melayu
- ไทย
- Tiếng Việt
- हिंदी
Silver: Big Move Coming?
Published 10/13/2013, 05:54 AM
Updated 07/09/2023, 06:31 AM
Silver: Big Move Coming?
Latest comments
Loading next article…
Install Our App
Risk Disclosure: Trading in financial instruments and/or cryptocurrencies involves high risks including the risk of losing some, or all, of your investment amount, and may not be suitable for all investors. Prices of cryptocurrencies are extremely volatile and may be affected by external factors such as financial, regulatory or political events. Trading on margin increases the financial risks.
Before deciding to trade in financial instrument or cryptocurrencies you should be fully informed of the risks and costs associated with trading the financial markets, carefully consider your investment objectives, level of experience, and risk appetite, and seek professional advice where needed.
Fusion Media would like to remind you that the data contained in this website is not necessarily real-time nor accurate. The data and prices on the website are not necessarily provided by any market or exchange, but may be provided by market makers, and so prices may not be accurate and may differ from the actual price at any given market, meaning prices are indicative and not appropriate for trading purposes. Fusion Media and any provider of the data contained in this website will not accept liability for any loss or damage as a result of your trading, or your reliance on the information contained within this website.
It is prohibited to use, store, reproduce, display, modify, transmit or distribute the data contained in this website without the explicit prior written permission of Fusion Media and/or the data provider. All intellectual property rights are reserved by the providers and/or the exchange providing the data contained in this website.
Fusion Media may be compensated by the advertisers that appear on the website, based on your interaction with the advertisements or advertisers.
© 2007-2024 - Fusion Media Limited. All Rights Reserved.
