Get 40% Off
🚨 Volatile Markets? Find Hidden Gems for Serious Outperformance
Find Stocks Now

Silver Prepares For Next Leg Higher

Published 01/31/2020, 02:46 AM
Updated 07/09/2023, 06:31 AM

Following up on some of our recent metals research, we are seeing significant opportunity in silver: we believe the metal continues to be one of the most incredible opportunities for 2020 and silver miners (NYSE:SIL) could explode to the upside as the price of silver rallies to close the gap between the gold to silver ratio.

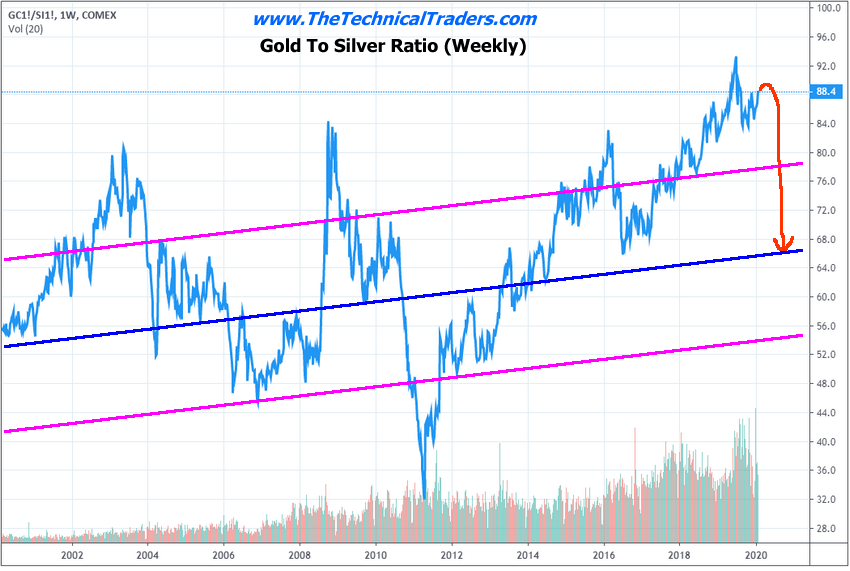
Our researchers believe silver is currently undervalued, compared to gold, by at least 240%. Historically, the gold to silver ratio averages a 10+ year rotational range of between 63 to 67. This means that through both peaks and troughs, ranging from the high 80s to mid-90s to the low 30s to mid-40s, on average the middle price range level for this ratio is near 65. Currently, this gold to silver ratio is 88.4.

Gold is currently trading at $1590 – just below the recent peak near $1613. We believe the yellow metal will continue to rally higher, breaking the $1613 level, and continue higher targeting the $1750 level over the next few months. Eventually, within 2020, we believe gold will continue to rally higher breaking the $2100 price level.

This continued upside price action in gold, while silver has really yet to see any massive upside price movement, continues to create a massive price disparity between gold and silver – which is highlighted in the gold to silver ratio. As gold rallies, silver must begin to move dramatically higher in order to close this price disparity between the value of gold to silver. Historically, we believe the rally in silver will force the gold to silver Ratio to fall to near the 65 level. This would represent a massive 70% to 120%+ rally in the price of silver – targeting $24.50 to 32.50.
3rd party Ad. Not an offer or recommendation by Investing.com. See disclosure here or remove ads .
Gold And Silver Ratio Weekly Chart

Gold and Silver Ratio Weekly Chart

If the gold to silver ratio falls below the 65 level and targets lower ratios, as has happened in the past, then silver may rally as high as $45 to $55 per ounce while Gold stays below $1800. If gold does rally above $2000, as we expect, the true potential for silver experiencing a major price reversion event could be as high as $60+ per ounce.Please take a minute to read some of our previous research posts regarding the metals markets here:January 14, 2020: SILVER TRADERS BIG TREND ANALYSIS – PART IIDecember 30, 2019: METALS & MINERS PREPARE FOR AN EARLY 2020 LIFTOFF

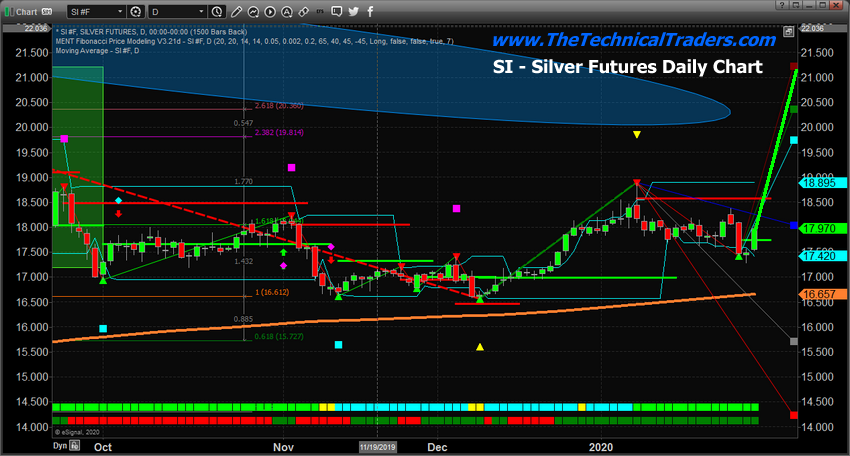
Daily Price Of Silver Chart

This Daily Silver chart highlights what we believe will be the next move higher in silver. The next upside price advance should target the $21 to $23 level as silver attempts to revalue compared to the price of gold. Near this $23 level, silver should stall briefly before attempting to move much higher. The reality is that once this revaluation event begins to take place in silver, we believe it will prompt an extended price rally that could last well into 2023-2024.
Daily Price Of Silver Chart
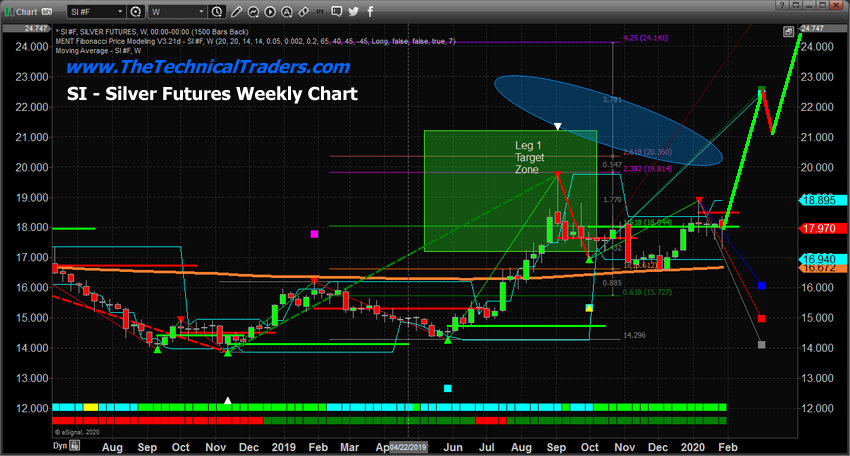
Price of Silver Weekly Chart

Price of Silver Weekly Chart

This Weekly Silver chart highlights our research team’s expectations related to silver over the next 6+ months. At first, we believe the $21 to $23 level will become the target. Then, a short period of price rotation will find support near $21 before another upside price leg pushes silver above $24. Remember, if gold continues to rally higher, these expectations could extend 5% to 10% in size and scale.

3rd party Ad. Not an offer or recommendation by Investing.com. See disclosure here or remove ads .

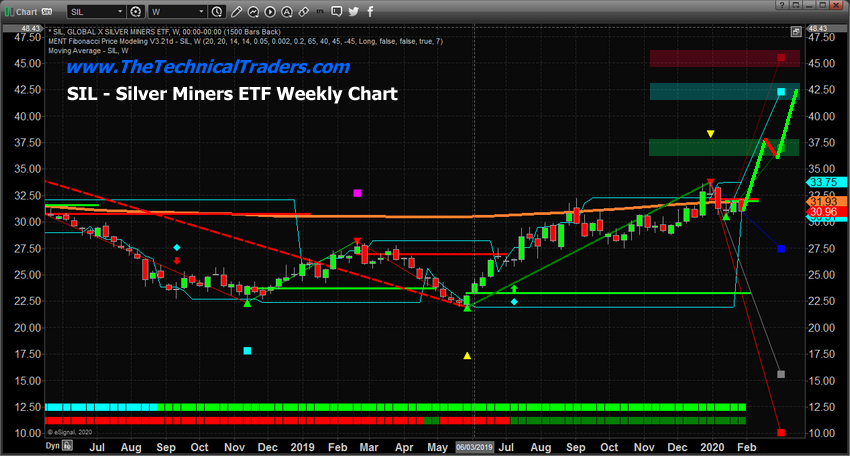
Silver Miners Sector ETF – Weekly Chart

Another key component of this move is the opportunity in silver miners. This SIL Weekly chart highlights the real potential for a 20% to 30% upside price rally related to the expected price revaluation/reversion event we have been describing for silver. Miners are an excellent correlative component for skilled traders expecting a move like this in the metals market.
Silver Miners Sector ETF – Weekly Chart

Latest comments

You did it again ! Just like platinum,, you talk it drops,,kiss of death,, it is going higher this year but u need to leave it alone , dont jinx it !
I call bull: "This would represent a massive 70% to 120%+ rally in the price of silver – targeting $24.50 to 32.50." In order for your lower end to match 70%, you'd have to count starting with $14.50... the higher end suffers from the same. So either your 'research team' can't do math, or you can't write using consistent facts and figures. I've already caught you using charts for the wrong market before.
I love u :)
Great article.. . . The Gold/Silver ratio should be glaring out at investors, like a nova exploding in our region of the Galaxy. However, I have this niggling feeling that this ratio might be viewed by some as being somewhat obsolete. Maybe because Silver, and Gold come to that, have been largely ignored during this long bull run. . . . Also, during this bull run, a new batch of investors have come to the market that have 1) never experienced the psychological pain of a stock market crash, and 2) seem to be comfortable in perceiving Bitcoin as something of a safe haven, rather then turning to traditional forms of protection. I could be wrong, but I think that they might learn a hard lesson going forward.
A more informative article.... Very very thanks Mr Chris
always appreciate a good analysis Chris, Thank you
Risk Disclosure: Trading in financial instruments and/or cryptocurrencies involves high risks including the risk of losing some, or all, of your investment amount, and may not be suitable for all investors. Prices of cryptocurrencies are extremely volatile and may be affected by external factors such as financial, regulatory or political events. Trading on margin increases the financial risks.
Before deciding to trade in financial instrument or cryptocurrencies you should be fully informed of the risks and costs associated with trading the financial markets, carefully consider your investment objectives, level of experience, and risk appetite, and seek professional advice where needed.
Fusion Media would like to remind you that the data contained in this website is not necessarily real-time nor accurate. The data and prices on the website are not necessarily provided by any market or exchange, but may be provided by market makers, and so prices may not be accurate and may differ from the actual price at any given market, meaning prices are indicative and not appropriate for trading purposes. Fusion Media and any provider of the data contained in this website will not accept liability for any loss or damage as a result of your trading, or your reliance on the information contained within this website.
It is prohibited to use, store, reproduce, display, modify, transmit or distribute the data contained in this website without the explicit prior written permission of Fusion Media and/or the data provider. All intellectual property rights are reserved by the providers and/or the exchange providing the data contained in this website.
Fusion Media may be compensated by the advertisers that appear on the website, based on your interaction with the advertisements or advertisers.
© 2007-2024 - Fusion Media Limited. All Rights Reserved.