Get 40% Off
👀 👁 🧿 All eyes on Biogen, up +4,56% after posting earnings. Our AI picked it in March 2024.
Which stocks will surge next?
Unlock AI-picked Stocks

Silver Makes High Candle At Target. Here's What To Expect

Published 07/29/2020, 09:40 AM
Updated 07/09/2023, 06:31 AM

Silver has made impressive gains over the past week which resulted from its breaking out at last from the giant Double Bottom base pattern that started to form as far back as 2013, so it’s been a long wait for silver investors for this to happen. Over the past week it has done exactly as predicted in the “breakout Souvenir article” posted on the site on the 22nd, running quickly at the strong resistance at the underside of the 2010 – 2013 top area, as we can see on its latest 13-year chart below, on which we can also see that volume hit an all-time record, which we take as a warning of temporary exhaustion, especially given the type of candle that formed yesterday, which we will proceed to look at lower down the page on the latest 6-month chart.
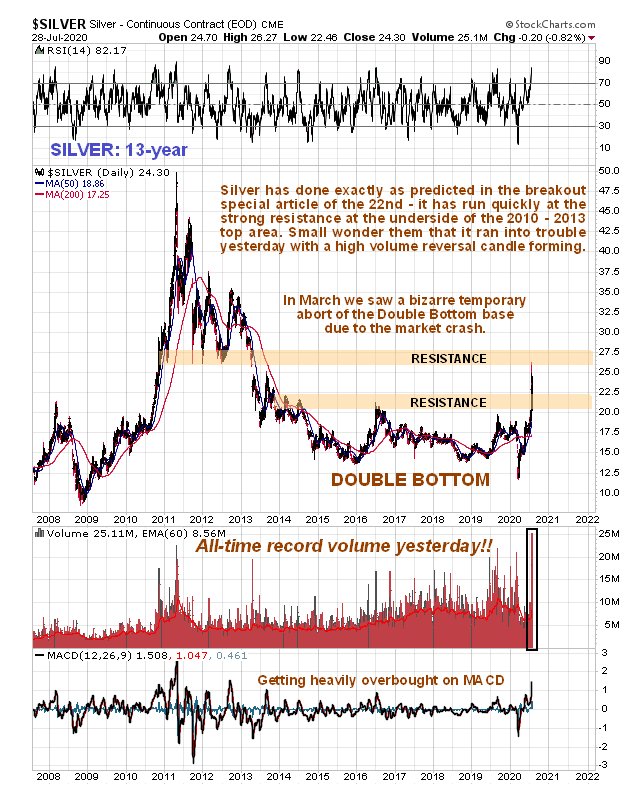
Silver 13 Year Chart


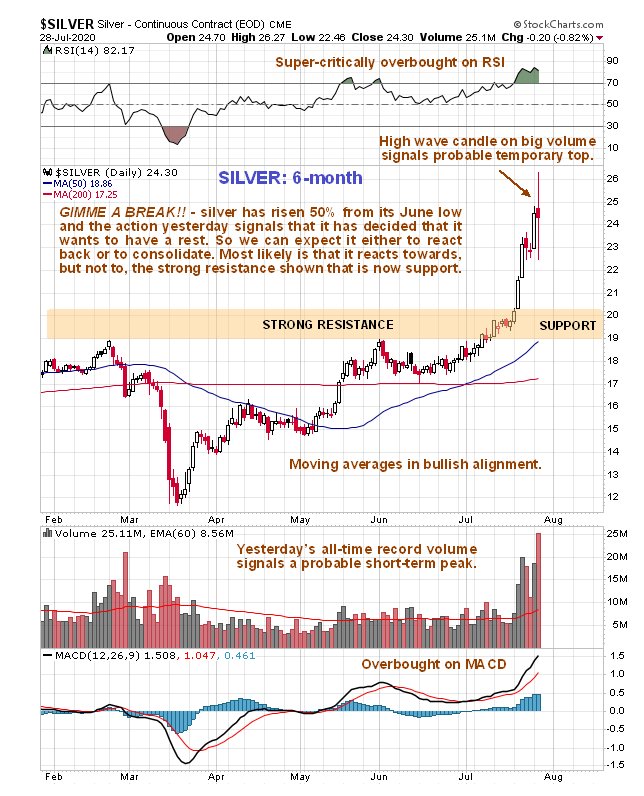
On the latest 6-month chart we see that silver has celebrated breaking free of the resistance at the top of the base pattern shown on the 13-year chart above by advancing swiftly in recent days, but yesterday’s further gains in the early trade saw it slam into a wall of overhanging supply at the underside of its 2010 – 2013 top area, which drove it back down again before the bulls gave it another go, so that in the end, after a major tug-of-war, it ended little changed on the day. However the high wave candle that this action on heavy volume left behind is symptomatic of a exhaustion and means that silver has likely put in a temporary high here. So we can now expect it to react back or consolidate for a while before it takes on and succeeds in overcoming this strong resistance.
3rd party Ad. Not an offer or recommendation by Investing.com. See disclosure here or remove ads .

Silver 6 Month Chart


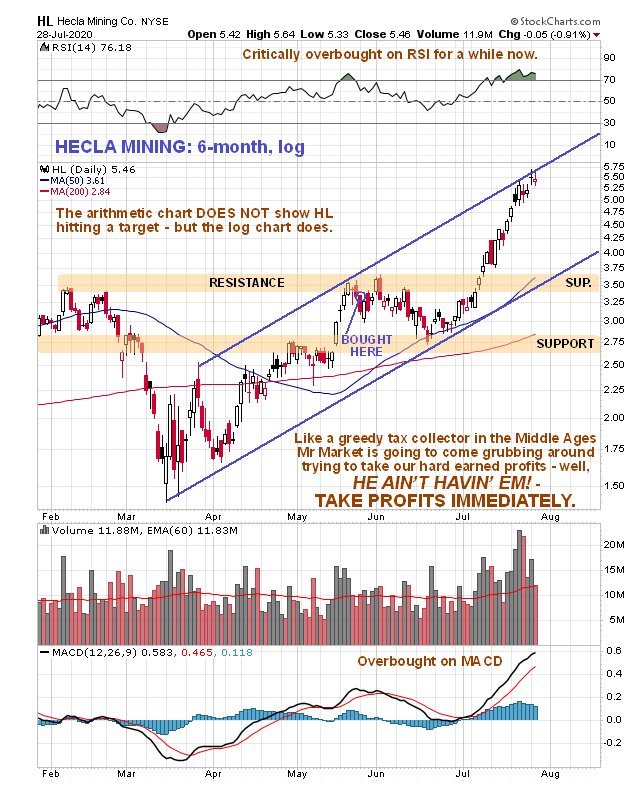
This is therefore thought to be a good juncture for traders to take some money off the table, especially in stocks that have risen a lot in recent weeks, like Coeur Mining (NYSE:CDE) and Hecla Mining that we bought back in May. The examples shown below, Couer Mining and Hecla Mining, are up 50% and 60% respectively since we bought them in May
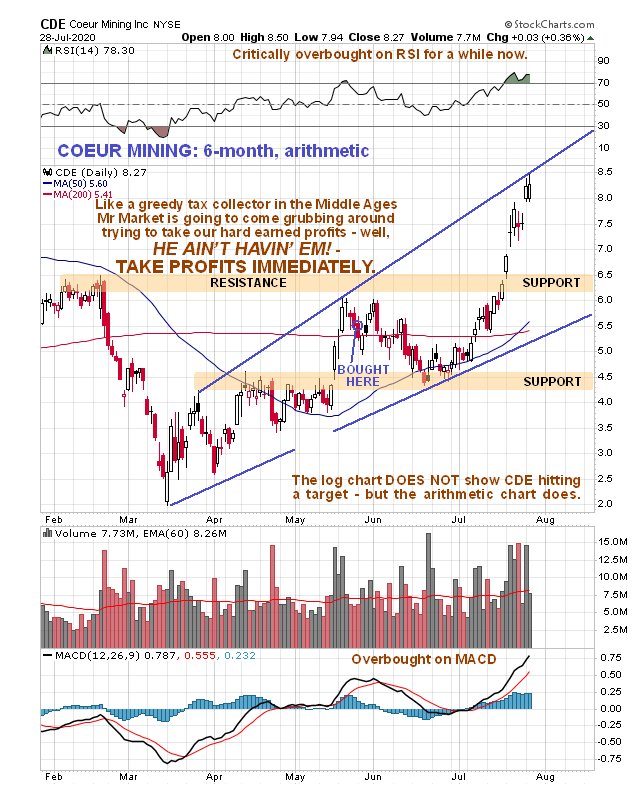
CDE 6 Month

H 6 Month Chart
Observe how in the case of Coeur, the arithmetic chart gives the target, while in the case of Hecla, the log chart gives the target. That’s we sometimes alternate the use of arithmetic and log charts.

Finally, it must be pointed out that THE LONGER-TERM OUTLOOK FOR SILVER COULD NOT BE MORE POSITIVE. We are only looking for a short-term correction / consolidation here.


Latest comments

CDE posted fantastic Q2 results, prospects are fantastic. Selling now is not smart.
Gold and silver are not normal investments. They shine every five years or so and then it is a parabolic outbreak with little corrections. I will not sell out and ride this to the top. It will last anyway just a few months more until these desert flower are going to sleep again for the next five years.
Risk Disclosure: Trading in financial instruments and/or cryptocurrencies involves high risks including the risk of losing some, or all, of your investment amount, and may not be suitable for all investors. Prices of cryptocurrencies are extremely volatile and may be affected by external factors such as financial, regulatory or political events. Trading on margin increases the financial risks.
Before deciding to trade in financial instrument or cryptocurrencies you should be fully informed of the risks and costs associated with trading the financial markets, carefully consider your investment objectives, level of experience, and risk appetite, and seek professional advice where needed.
Fusion Media would like to remind you that the data contained in this website is not necessarily real-time nor accurate. The data and prices on the website are not necessarily provided by any market or exchange, but may be provided by market makers, and so prices may not be accurate and may differ from the actual price at any given market, meaning prices are indicative and not appropriate for trading purposes. Fusion Media and any provider of the data contained in this website will not accept liability for any loss or damage as a result of your trading, or your reliance on the information contained within this website.
It is prohibited to use, store, reproduce, display, modify, transmit or distribute the data contained in this website without the explicit prior written permission of Fusion Media and/or the data provider. All intellectual property rights are reserved by the providers and/or the exchange providing the data contained in this website.
Fusion Media may be compensated by the advertisers that appear on the website, based on your interaction with the advertisements or advertisers.
© 2007-2024 - Fusion Media Limited. All Rights Reserved.