Last week was a stellar week for stocks as they shook off the major spike lower we saw on the Brexit vote.
It was by far the best week of the year that has been mostly chop.
It only takes a week or two like this to make your year a very respectable one but the sitting and waiting for the right time to trade can be painfully boring sometimes.
I am in my full trading positions which I entered Tuesday and I am treating them as a swing trades, which means I’ll be locking in gains on any sign of weakness, but of course I’d prefer to hold them longer if they allow me.
The metals continue to act strong as well with silver leading gold and mining stocks really kicking into gear and I did buy into one in particular late Thursday and that one stock was up a very nice 8.98% Friday.

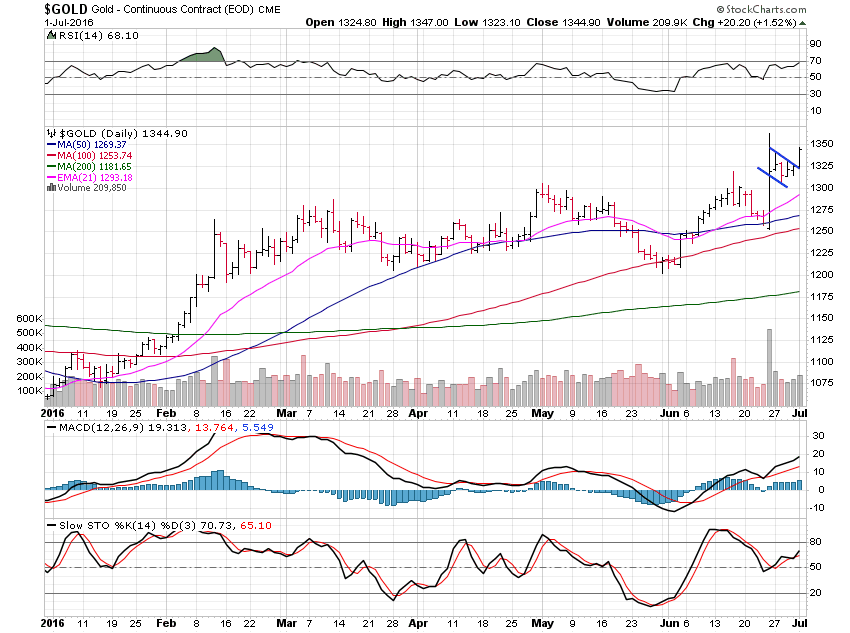
Gold rose just 1.96% as it floundered in a small bull flag all week and let silver lead the way before finally beginning to move Friday. Great action as it’s moving up on increasing volume.
Looking at the weekly chart I see $1,430 as the next resistance level to look for. The great dominant trend change in gold is well underway and it’s solidly to the upside now and we are still in the very early stages of this move so I’d suggest buying weakness and having a time-frame of 3 to 5 years in this trade.

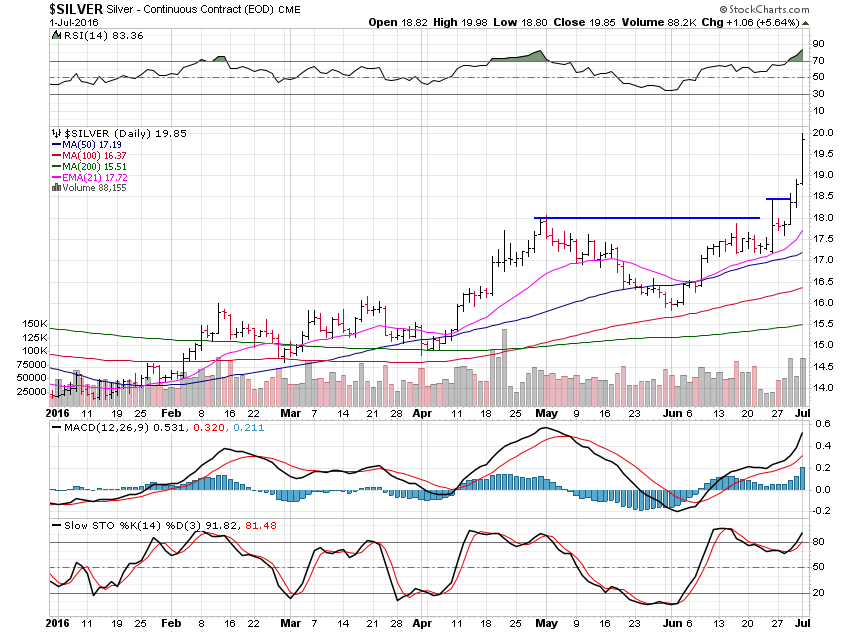
Silver flew off the handle rising 11.42% for the week and taking the lead in the race to higher prices. Nothing bad to say here as we cleared the $18 area which has been a major pivot level dating back to 2008, and doing so on nice increasing volume.
Now I’ll look to $21.75 as the next major resistance level. We’re in the early stages of this new phase of the bull market so I’d continue to buy weakness and hold for 3 to 5 years. I did buy some silver on my way home from a little trip early in the week passed but I’ve yet to buy any more physical gold, but it won’t be too long.
I will hold much more silver than gold since it will do much better as we’ve just seen in the week passed.

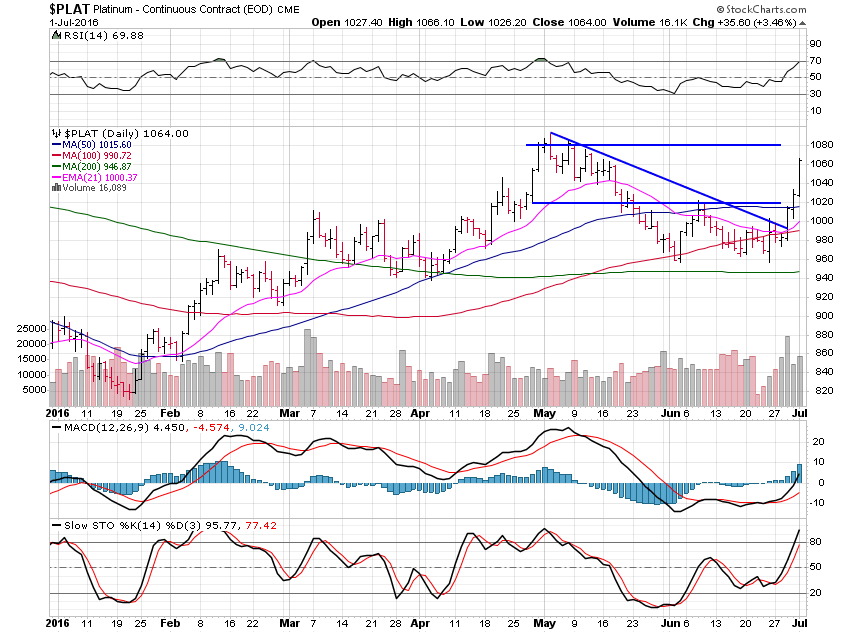
Platinum gained a respectable 7.67% this past week and is nearing resistance at $1,080. As always, platinum follows silver and gold, and will continue to do so until this new bull market runs its course.

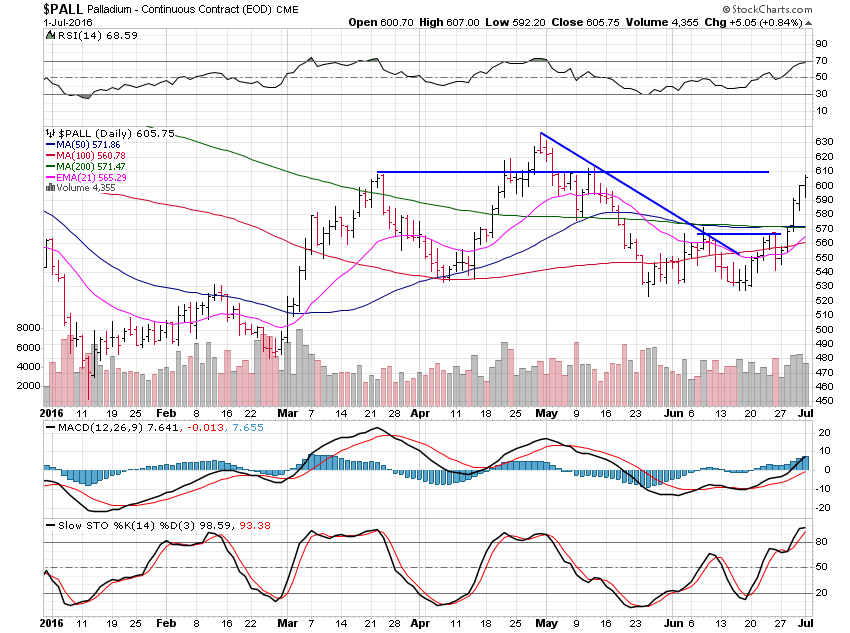
Palladium gained 10.19% as it nears some resistance at the $610 area. Looking at the weekly chart, I’ve got to look up to $690 for the next resistance level.
All in all, a superb week with great action that I’d really love to see continue but all I can say there is, time will tell.
The action is great and telling me we will continue higher but nothing is ever certain in life, especially so in stocks.