It’s been a wild couple of weeks for the silver bulls, as extreme exuberance and calls for $25.00/oz by Thanksgiving have quickly turned into talks of manipulation. While many are chalking up the correction to improvements in the China Trade talks with the US, the real reason for the drop is that nothing ever goes up in a straight line. Even if the Fed had come out with an impromptu rate-cut before their September meeting; there was no way silver was going to head over $21.00/oz this month when everyone was already in the trade. This recent correction has shaved 11% off of the price of silver, and it is certainly a much lower risk spot to buy than where we sat at $19.50/oz just two weeks ago. However, I don’t see any reason to get aggressive on the buy-side at current levels. This correction may have delivered a beating to the bulls, but the sentiment is suggesting that very few have thrown in the towel. For this reason, I’m not convinced the correction is over just yet.
Taking a look at the below chart of sentiment, we can see that we’re sitting at the 61% bulls level for silver. While this is a massive improvement from 97% bulls two weeks ago, it’s still quite elevated considering we just got an 11% correction. To put this in context, the 11% correction in the Nasdaq 100 (QQQ) in June saw bullish sentiment fall to the 12% level.
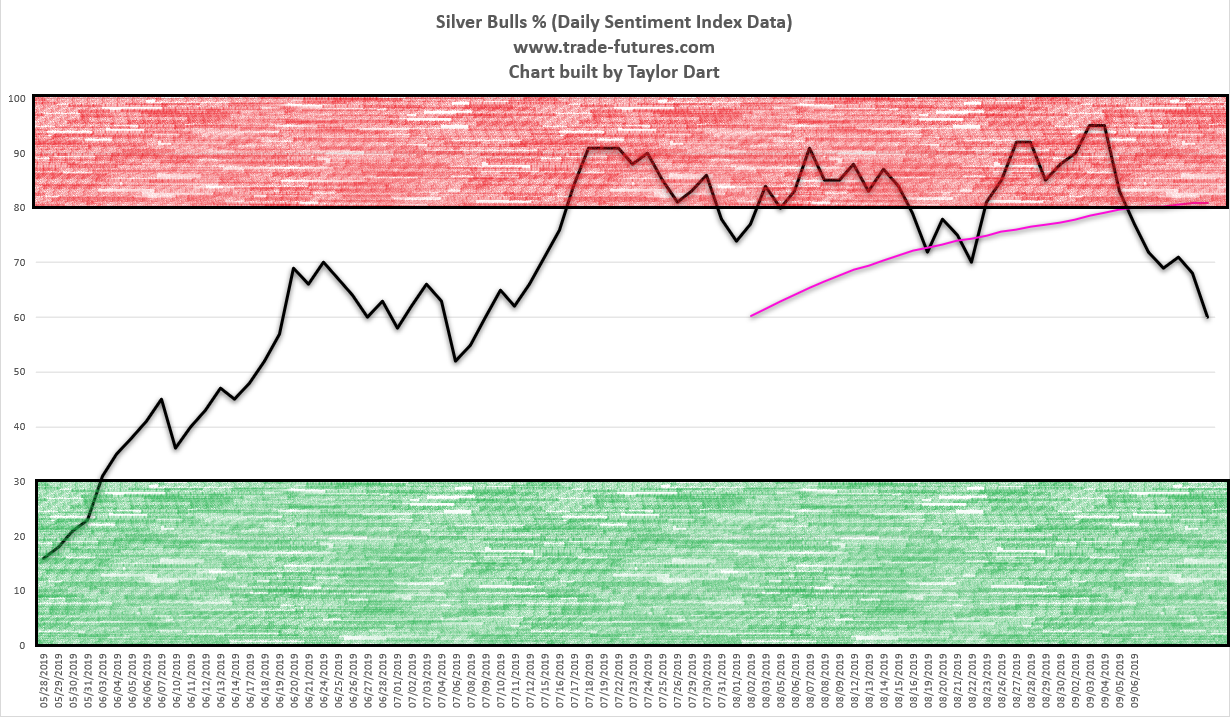
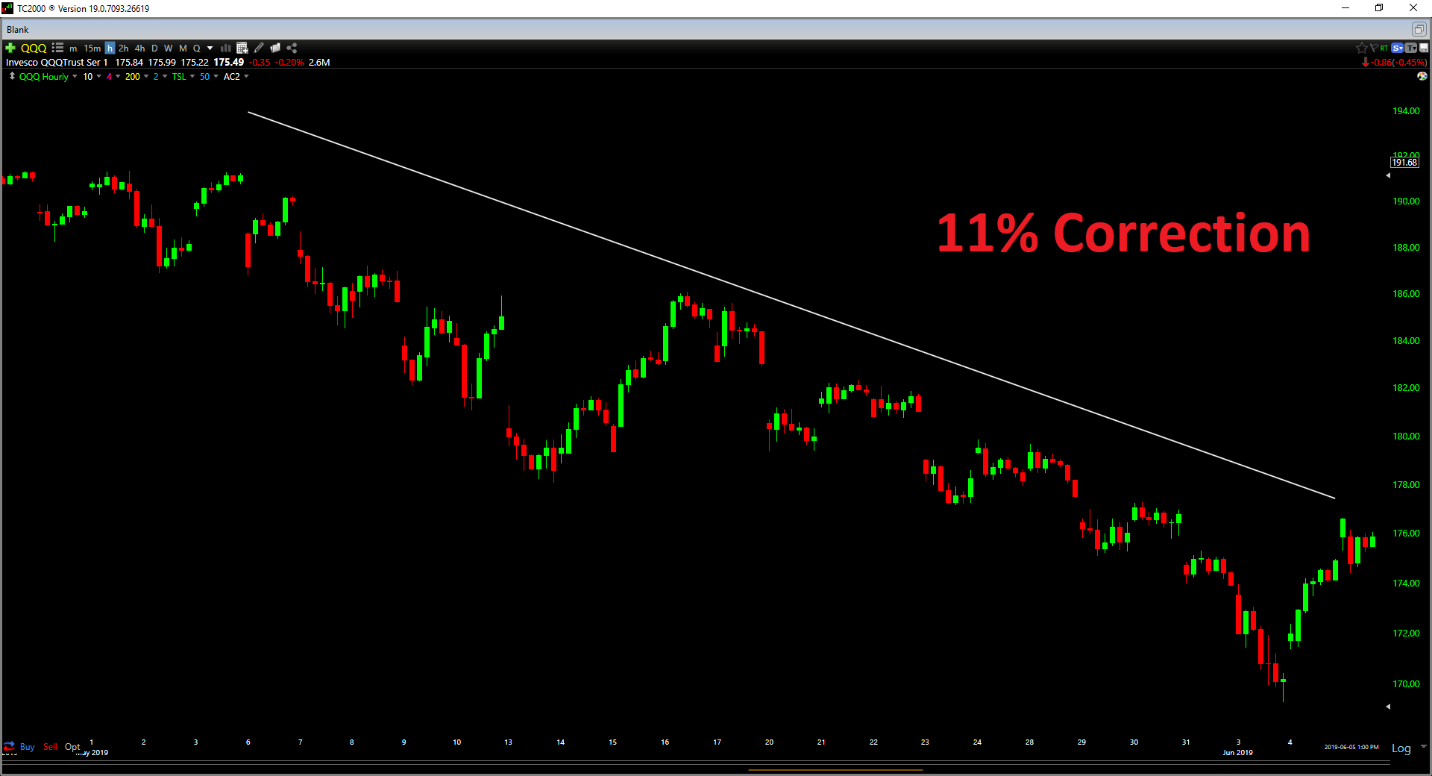
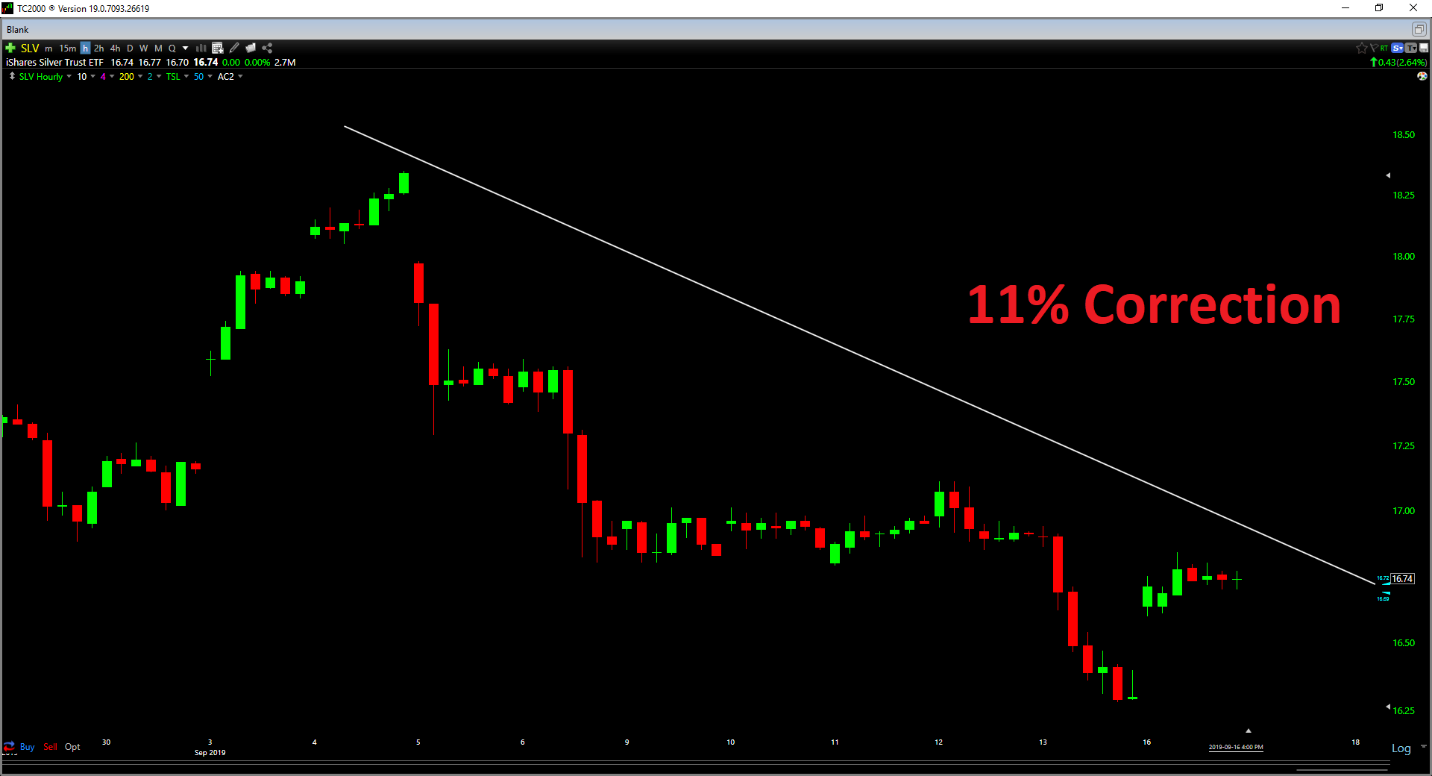
While this drop to 60% bulls is a big step in the right direction, it is quite rare for an asset class to put in a swing low at a sentiment level that remains this elevated. This is especially true if the asset class has just retreated from a level of irrational exuberance. While a bounce is possible to remove oversold conditions, I would be surprised if we did not see a lower low below $17.50/oz before this correction is over. The good news for the bulls is that 11% plus pullbacks like we have seen are just noise in the bigger context as long as they hold above $16.25/oz on a weekly close.
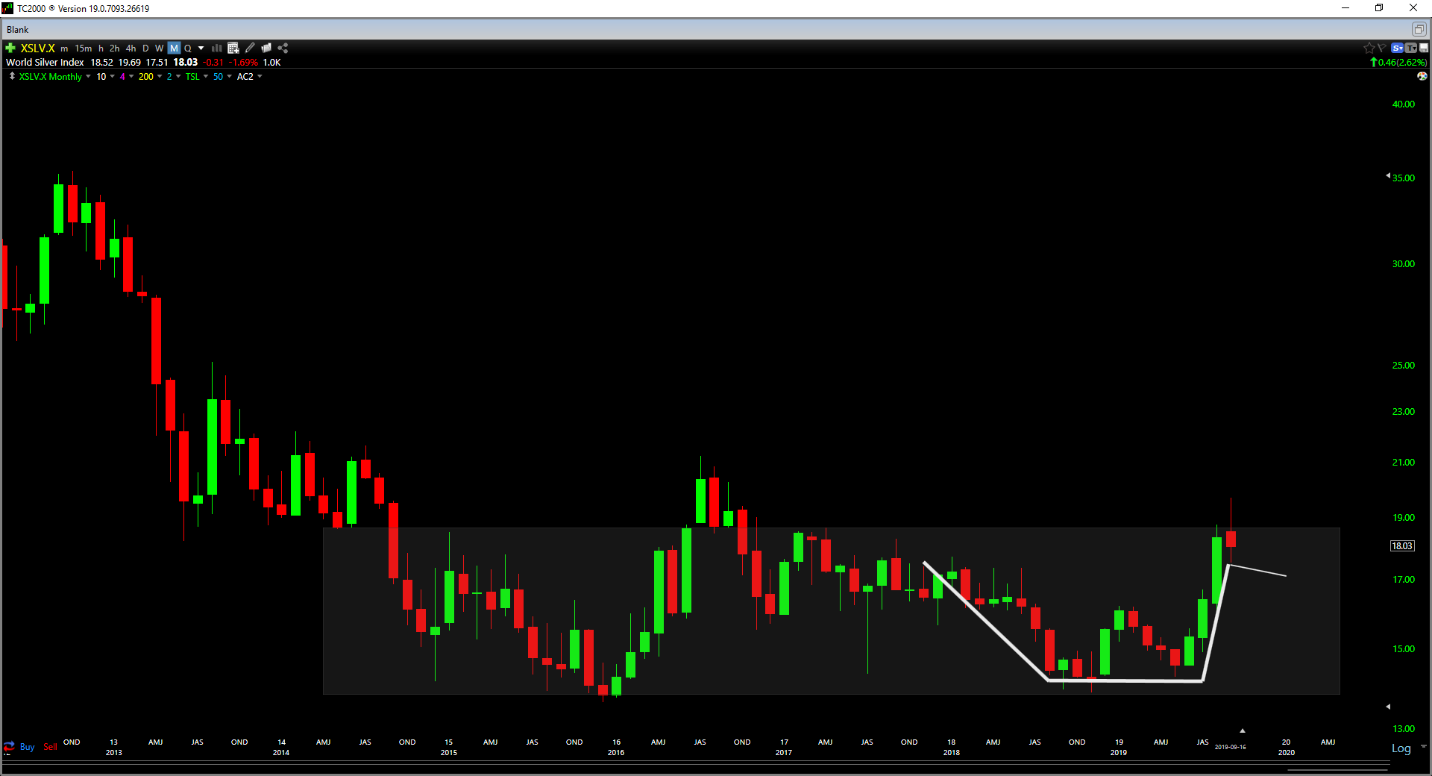
Taking a look at the above monthly chart, we can see that silver has built a 1-year saucer-shaped base, and this correction is likely building the handle out to that base. Handles typically range in duration from one month to three months, and this would dovetail with what would be required to grind down the bulls and lower current sentiment readings a little. Zooming in to the daily chart below, we can see that upper support sits at $17.25/oz, with strong resistance at $18.45/oz. Any bounces from this level that cannot get above the $18.45/oz level on a weekly close would simply be oversold bounces after the waterfall decline we’ve just seen. The key to putting this correction in the rear-view mirror would be a strong close above $18.45/oz.
In terms of buying the dip, the $17.25/oz level is a much more reliable level that I’m watching, and an area I’d be more comfortable with establishing some new positions in the metal. While it may seem like nit-picking to only be interested in buying at $17.25/oz and holding out for another 1.5% drop from the $17.50/oz low we saw last week, the issue is the sentiment. If we had seen the $17.50/oz low with a complete capitulation by the bulls and a drop to 30% bulls, this would be a different story. Instead, we see a much higher reading in sentiment that what I would have expected at current levels.
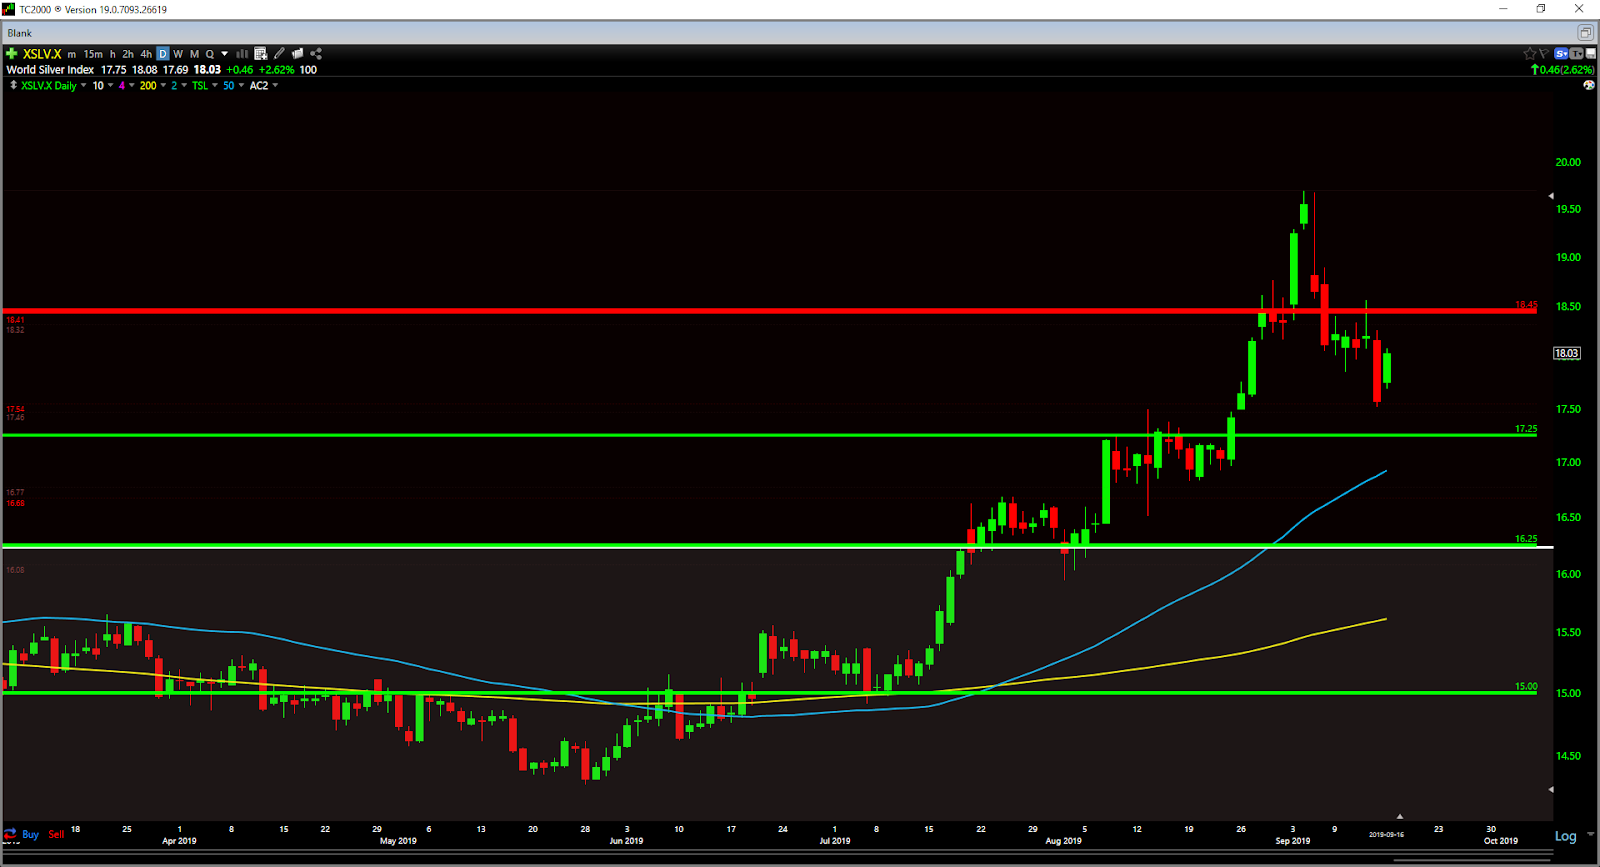
To summarize, this correction is a step in the right direction, and we’ve likely seen the worst of it. However, I still believe we have a little further to go before a reliable low is in. Bounces are possible, but I’d consider bounces that can’t get through $18.45/oz to be noise. The bulls have become a little nervous, but I prefer to buy when they’re puking up their positions instead. For this reason, I believe that patience is still the best course of action. As long as the bulls defend the $16.25/oz level on a weekly close going forward, this bull market remains intact, and this is just a violent shakeout to part the weak-handed bulls of their positions.
The iShares Silver (NYSE:SLV) was trading at $16.78 per share on Tuesday morning, up $0.04 (+0.24%). Year-to-date, SLV has gained 4.94%, versus a 12.91% rise in the benchmark S&P 500 index during the same period.
SLV currently has an ETF Daily News SMART Grade of C (Neutral), and is ranked #9 of 33 ETFs in the Precious Metals ETFs category.
