Talking Points
- Gold and Silver to extend falls as traders look past dovish Fed and Ukrainian tensions
- WTI vulnerable to disappointing US manufacturing data sub-$100.00 handle
- Commodities head into an historically weak period near key technical levels
Silver prices have plunged to the critical $19.00 handle while gold has resumed its declines with prices pushing below $1,290 in Asian trading. Ebbing geopolitical risks may spell further weakness for the precious metals as abating tensions in Eastern Europe sap safe-haven demand for the commodities. Crude Oil may also face further selling pressure if upcoming US ISM Manufacturing figures continue the trend of disappointing US economic data.
Metals To Suffer Further As Traders Discount Geopolitical Risks
Gold and silver have seemingly fallen out of favor with investors as the precious metals continue their slide. This comes despite a dip in the greenback overnight on the back of a dovish lean from the FOMC policy statement and a weaker-than-anticipated US first quarter GDP print. The weakness for gold likely stems from traders looking past the ongoing Ukrainian turmoil with recent sanctions from the West potentially seen as an underwhelming response to the crisis.
In the absence of an escalation in Eastern Europe gold may be vulnerable to further declines. Additionally abating concerns over supply disruptions of key Russian commodity exports may bode ill for crude oil and Palladium prices. The world’s largest energy producer supplies roughly one third of Western Europe’s oil, and accounts for over 40% of global palladium supply.
Crude Vulnerable To US Manufacturing ‘Miss’
The anemic US Q1 growth figures coupled with a rise to record levels for crude inventories has added to selling pressure on WTI. As noted in recent commodities reports; a glut of US supply paints a bearish picture for crude oil over the near-term. The growth-sensitive commodity is also vulnerable to continued disappointing US economic data prints via the demand side of the equation. This leaves oil exposed to further weakness on a miss from the upcoming US ISM Manufacturing figures.
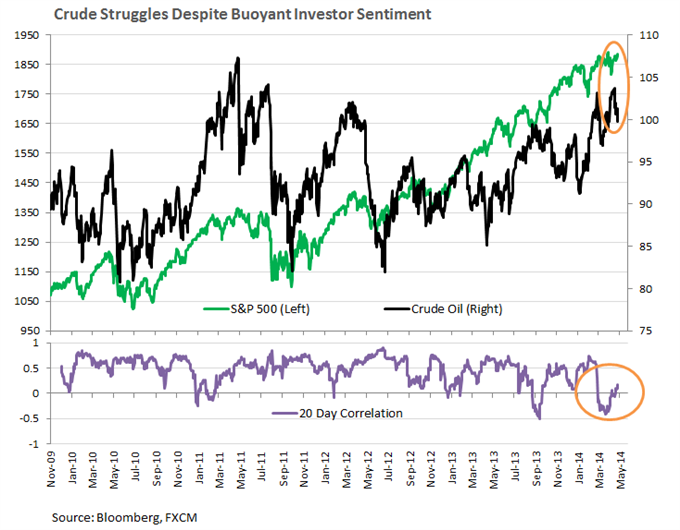
Broader risk-trends have also offered additional bearings to oil prices in the past. However, we’ve seen the lift in sentiment (as demonstrated by near record highs for the S&P 500) fail to bolster demand for crude over April. Barring a complete shift to risk-aversion from investors, the supply and demand story may continue to be the dominant driver of price action for the commodity in the near-term.
- Commodities Heading Into Period of Historical Weakness
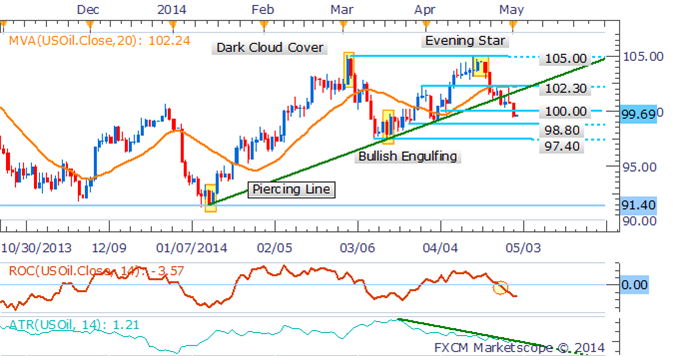
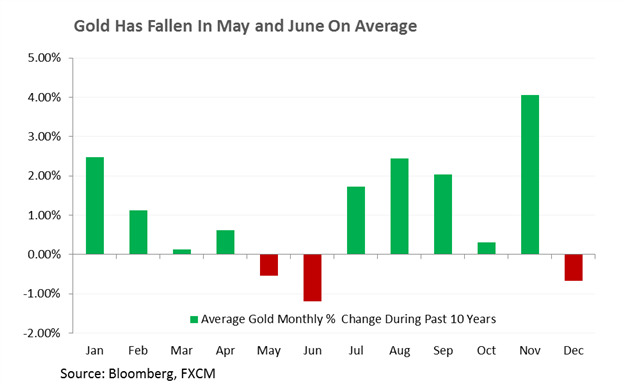
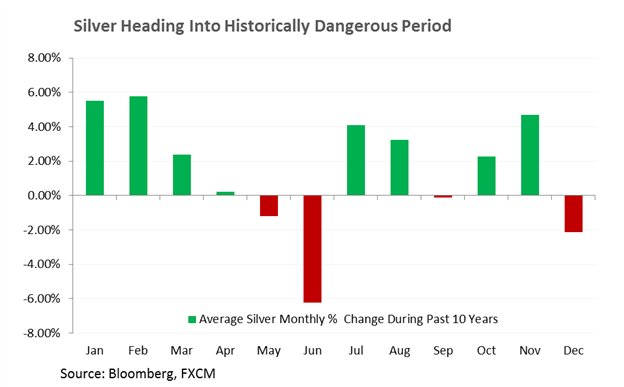
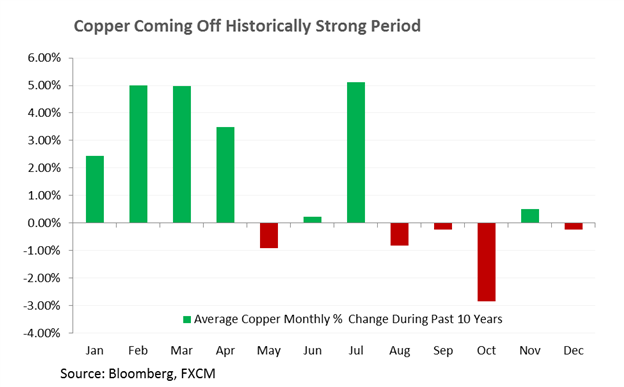
- Historically May is one of the weaker months for crude oil, on average over the past 10 years, the commodity rallied by only a third of a percent for the month, compared to average gains of almost 5 percent in February and March. Meanwhile May and June have been two of the worst performing months for the precious metals; with silver having posted a colossal average decline of 6.21 percent over the ten year period from 2003. The seasonality studies are presented below the technical analysis write-ups.
CRUDE OIL TECHNICAL ANALYSIS
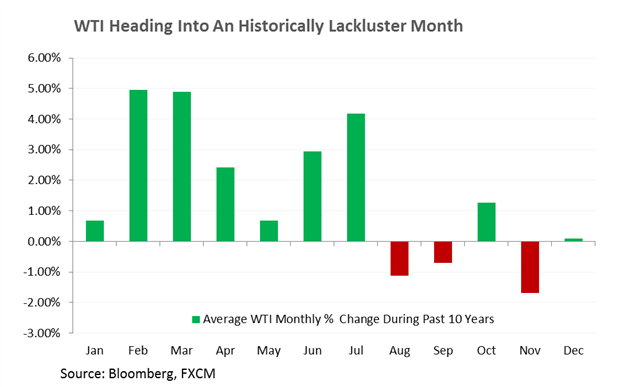
Crude oil has broken below trendline support following the emergence of an Evening Star formation on the daily. Alongside building downside momentum (reflected by the rate of change indicator) and a move below the 20 SMA a bearish technical bias is offered. The daily close below the psychologically significant $100.00 handle is seen as an opportunity to enter new short positions. However, traders should also be mindful that volatility, reflected by the ATR continues to decline, which generally doesn’t favor breakout trading.
Crude Oil: Faces Test Of Critical $100.00 Handle
Daily Chart - Created Using FXCM Marketscope 2.0
GOLD TECHNICAL ANALYSIS
Technical signals for gold are leaning on the bearish end of the spectrum suggesting the precious metal may face a drop to nearby support $1,277 before buyers emerge. This comes after the commodity failed to crack the key resistance near $1,305 which coincided with the third touch and respect of a descending trend line. A break below $1,277 would likely open extended declines towards the next definitive level at $1,240.
The DailyFX Speculative Sentiment Index suggests a mixed bias for gold based on trader positioning.
Gold: Set For Next Leg Lower As Descending Trendline Holds
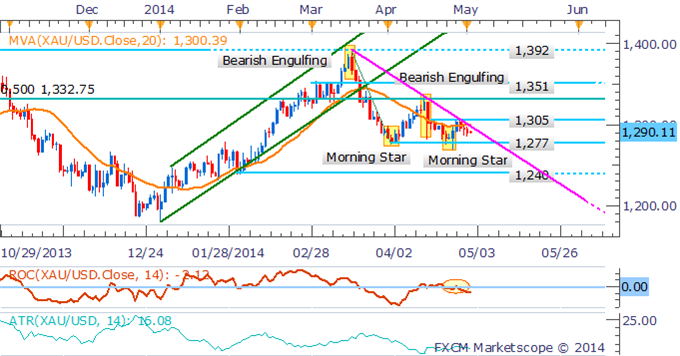
Daily Chart - Created Using FXCM Marketscope 2.0
SILVER TECHNICAL ANALYSIS
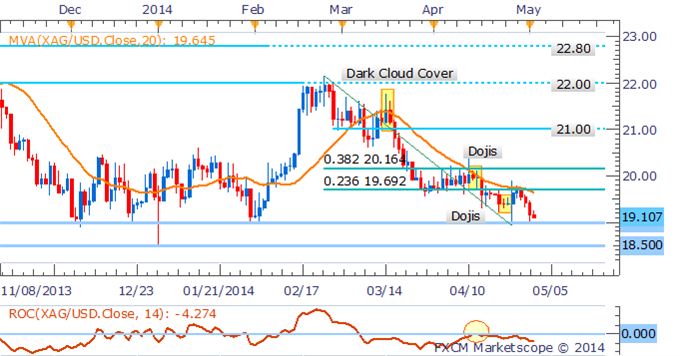
The silver bears have firmed their grip on prices with the precious metal plunging to the critical $19.00 handle in recent trading. Bearish technical signals remain with prices below the 20 SMA and a negative reading from the rate of change indicator. However, new shorts would be better served on a break below $19.00, or a retracement to $19.65 given the strong buying support at current levels.
Silver: Plunges To Key Support Level
Daily Chart - Created Using FXCM Marketscope 2.0
COPPER TECHNICAL ANALYSIS
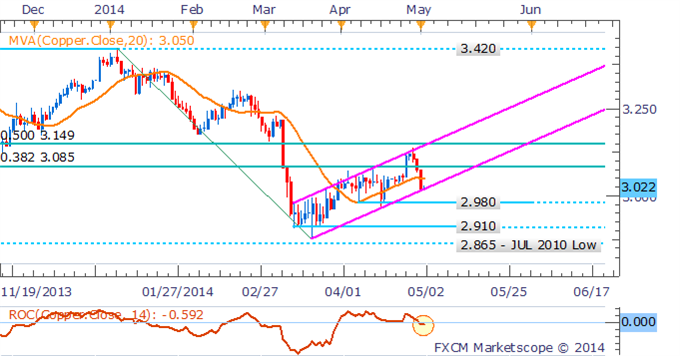
Copper has pulled back from the top its ascending trend channel and cracked the $3.085 mark in recent trading. Although the lower trend channel line may offer some interim buying support, the next definitive level rests at $2.980, which may leave the bulls to remain in their pens. This leaves a mixed technical bias for the base metal.
Copper: Bulls Uninspired Following Drop Below Support
Daily Chart - Created Using FXCM Marketscope 2.0
PALLADIUM TECHNICAL ANALYSIS
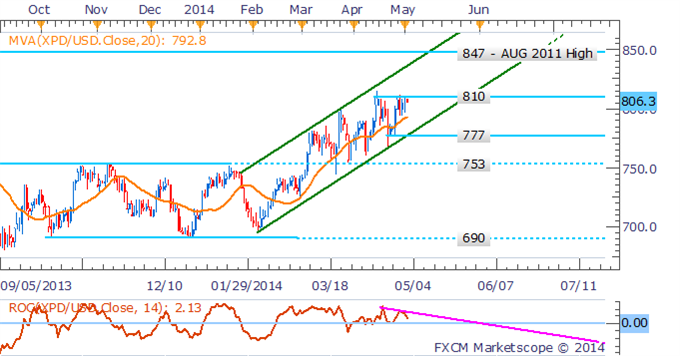
Palladium remains in an upward trend channel following the original breakout above the range-top at $753. However, the 2014 highs near $810 continue to cap gains for the precious metal. While there had been hints at a dip from candlestick reversal patterns, a correction has failed to materialize. A break above $810 would offer an extended advance to the August 2011 high at $847.
Palladium: Teases Traders Near 2014 Highs
Daily Chart - Created Using FXCM Marketscope 2.0
PLATINUM TECHNICAL ANALYSIS
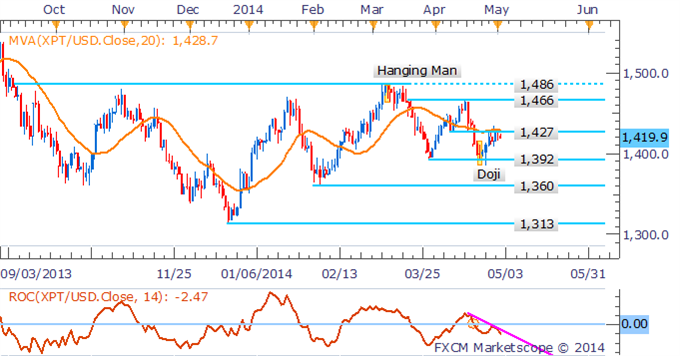
The multi-month consolidation between $1,313 and $1,486 for Platinum continues with prices failing to push above $1,427 in recent trading. A further pull back is likely to be met by buying support at the $1,392 mark.
Platinum: Recovery Stalls At $1,427
Daily Chart - Created Using FXCM Marketscope 2.0
