
Precious metals have been on our radar for many months and, if you've been paying attention, you probably already know our research suggests gold and silver are one of the best investments you can make right now.
Recently, we shared this article suggesting gold would need to rally above our proprietary Fibonacci Price Amplitude Arc (GREEN Arc) level near $1,745 before it would attempt a bigger upside price move. Additionally, just a few days ago, we published this article suggesting silver would begin to rally even faster than gold.
Today, both gold and silver are making bigger upside price moves, with silver up over 3%, while gold is up 1.3%. We believe this nearly 250% faster silver advance may be the start of what we have been predicting for many months – an incredible parabolic upside price advance in both gold and silver.
Earlier research by our team suggested that a set up would happen in Precious Metals, where silver began advancing much faster than gold and that this move would likely prompt a downside move in the gold-to-silver ratio targeting the 50 to 65 level. Our earlier research suggests when this move/setup begins, we could begin to experience a nearly 250% to 350% rally in gold, targeting $3,750
or higher, and a 550% to 650% rally in silver, targeting over $70, over a 12+ month span of time.
This article, today, is alerting our readers that we believe this setup is happening right now, and the upside rally in precious metals should begin to really accelerate over the next 5+ months.
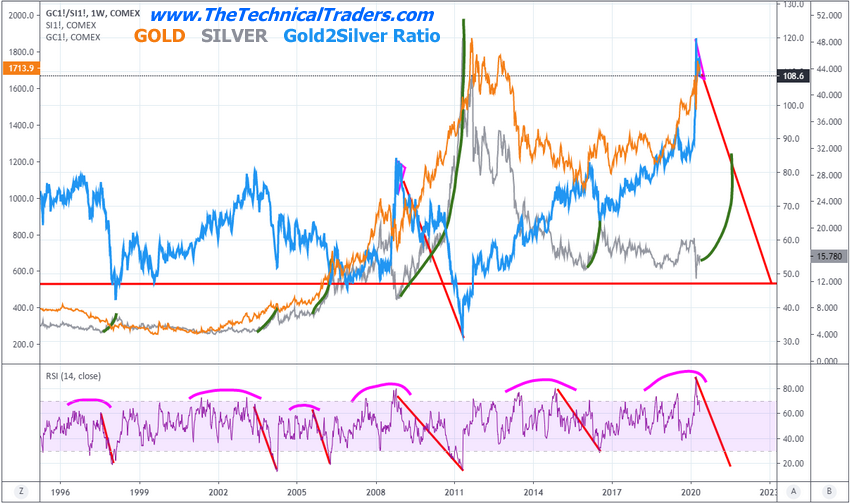
Weekly Gold-to-Silver Ratio Chart
This gold-to-silver ratio chart (including gold and silver price levels) clearly illustrates what happens when the gold-to-silver ratio starts to collapse. In 2009, the BLUE gold-to-silver ratio level began to collapse from 85 to 32 – well over 50 points (58%). The current gold-to-silver ratio high is nearly 120. Another 58% collapse from that level would suggest the ratio could fall to 50 (or further), which would indicate that both gold and silver could rally extensively throughout the next 12+ months.
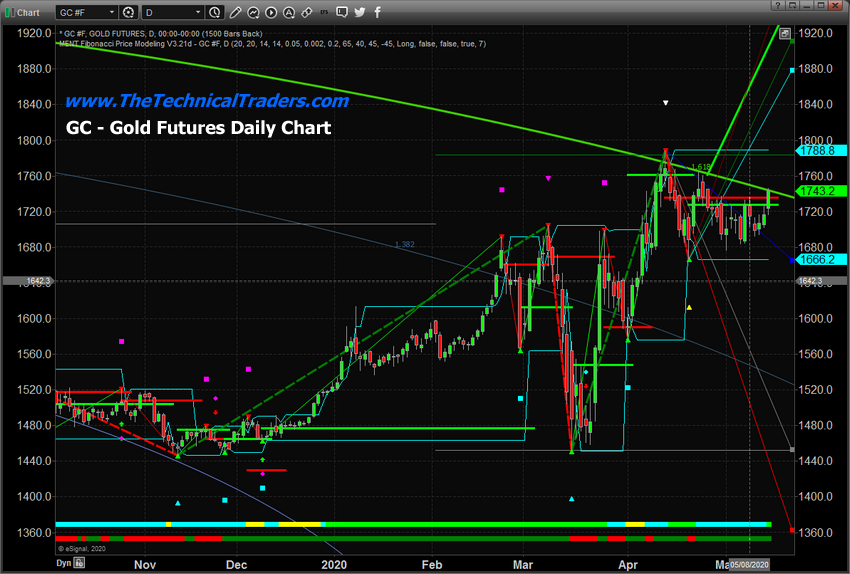
Daily Gold Futures Chart
This Daily Gold chart highlights our proprietary Fibonacci Price Amplitude Arc system as well as our Fibonacci price modelling system. Our researchers believe once gold rallies above the green arc, it should begin to skyrocket higher in a series of upside price advances over the next few months or longer. This 1.618 Fibonacci Price Amplitude Arc is acting as a strong resistance level currently.
Once gold breaks above this level, a big rally may take place in gold – which will drive further a bigger rally in silver.
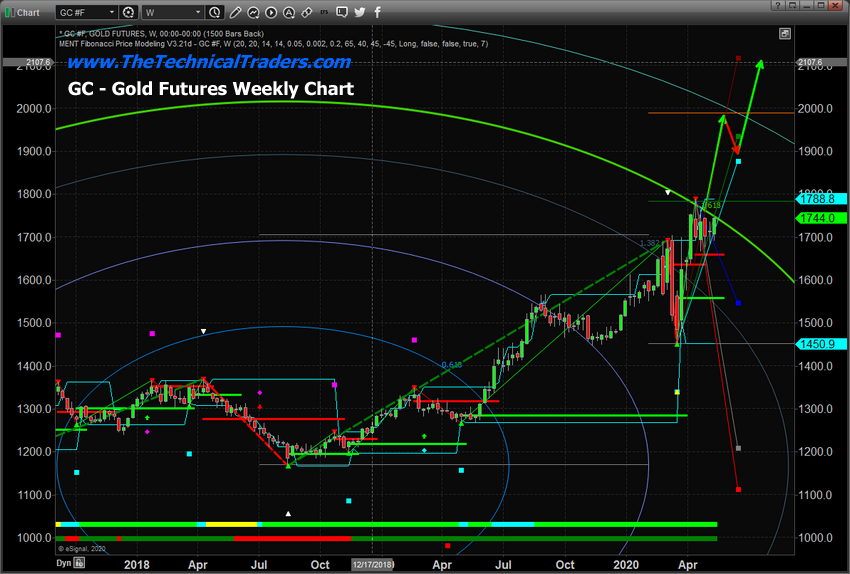
Weekly Gold Futures Chart
This weekly gold chart shows you what we expect to see happen over the next 30 to 60 days.
First, once gold breaks the green arc level, a rally will take place driving gold up to near $1,999. Then, gold prices should stall and rotated downward a bit – targeting the $1,900 to $1,920 level. After that, gold will begin another upside price rally targeting $2,100 or higher.
Ultimately, our upside price target for gold is $3,750 (many months into the future). Yet, we continue to believe this move in precious metals could be one of the biggest and fastest upside price moves in over 100 years. We believe once this move really gets started, it will be almost impossible to accurately predict where the top will setup in gold and silver.
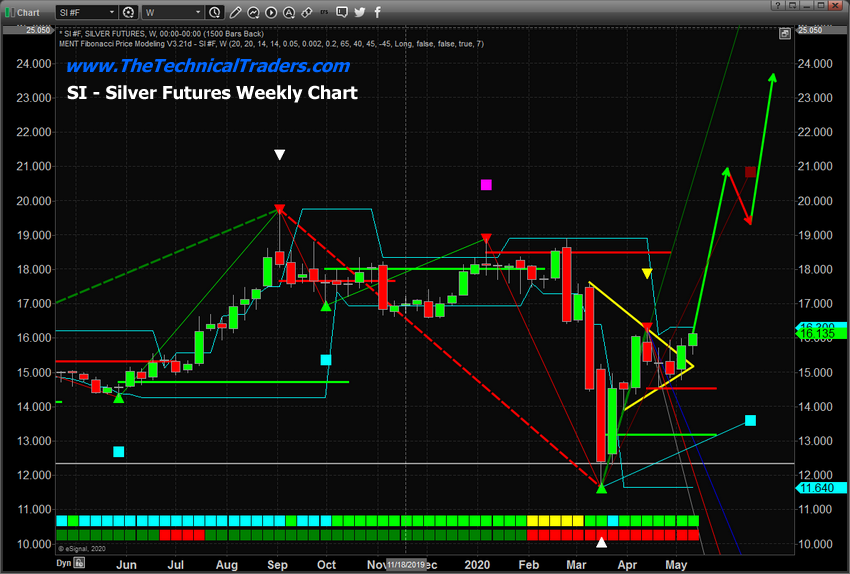
Weekly Silver Futures Chart
This weekly silver chart highlights the Pennant/FLAG formation that recently APEXed. We suggested this setup would prompt a fairly strong upside price move in silver targeting the $21 to $22 –
establishing a new price high. Just after the Apex completed, silver stalled a bit before beginning a bigger upside move. We believe this is the start of a parabolic upside price move in metals that should not be overlooked by skilled technical traders.
Concluding Thoughts:
If there is one thing you should understand about this setup and the potential for the future is that between 2008 and 2011, gold rallied over 300%, while silver rallied over 600% just after the credit
crisis event. The current COVID-19 global economic crisis is likely much bigger than the 2008-09 credit crisis event and that is why we believe this is an incredible opportunity for skilled technical
investors.
We've been writing research articles about this setup for more than two years now. We began calling this move back in 2017 and 2018. It may seem like we keep writing about metals because we have nothing else to write about – but that's not the case. We keep pushing this research out to you because this is very likely the biggest opportunity of your lifetime. The entire recovery process, starting now and going forward for as long as it takes, will present numerous incredible opportunities for skilled technical traders. Precious metals are only one segment of this move. What happens later this year, next year and the years following are when we will really see huge opportunities for skilled technical traders to generate profits.
Please, take a moment and do some research. We don't know where you are going to find many opportunities that beat this setup in precious metals right now. This is the trade/setup of your lifetime.