
Despite yesterday’s bearish opening gap, the bulls closed it, taking prices higher in a very measured and cautious way. Then, the bears took over the reins and drove the index well below the levels at the start of the day. Have we seen a reversal?
In short, that’s very unlikely – and not only because of the low volume of yesterday’s downswing.
S&P 500 in the Short-Run
Let’s start with the daily chart perspective (charts courtesy of http://stockcharts.com ):
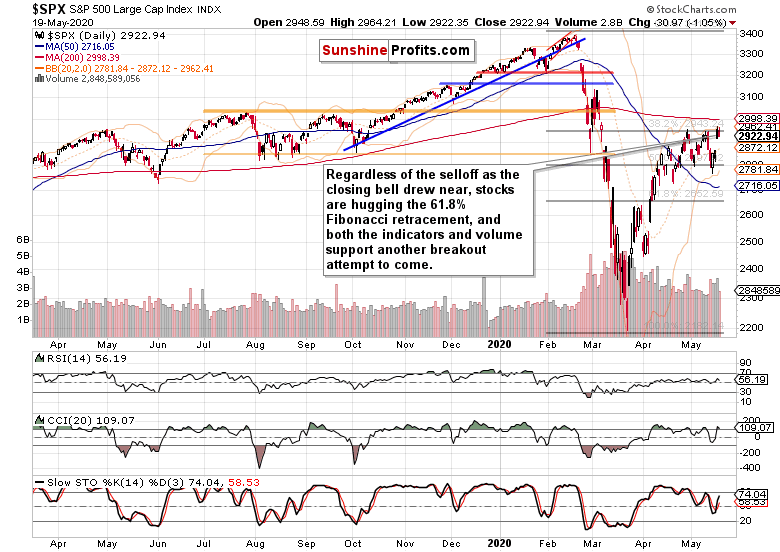
The much anticipated testimony by Fed chair Jerome Powell, along with Treasury Secretary Steve Mnuchin, was treated by the market place as a non-event. Stocks recovered from the initial setback, and it was only the final 75 minutes of trading that took them down. While the slide may have looked impressive given the low intraday volatility, has it achieved anything lasting and of importance?
Both the volume and daily price action examination hint at merely a consolidation in an unfolding upleg. Stochastics is still on its buy signal, the CCI in the uptrend territory, and we better not read too much into the RSI curling lower. On balance, the daily indicators are supporting the bullish case and another breakout attempt over the 61.8% Fibonacci retracement. Metaphorically speaking, stocks are like a coiled spring now.
The importance of overcoming this resistance can’t be overstated for the institutional investors. With the rise of passive investing we’ve seen over the decade (yes, it had more assets under management than active investing for a good few years already), how much new buying will it bring in as the resistance is overcome?
In our opinion, just enough to put a good floor below stocks. A market-based one, this time. And the examination of money flows from the money market funds supports that conclusion too, because last
week’s pullback was heavily bought.
But last week, it were the credit markets, that were profoundly lagging and flashing caution. What about now, have they sold off during yesterday’s stock pullback?
The Credit Markets’ Point of View
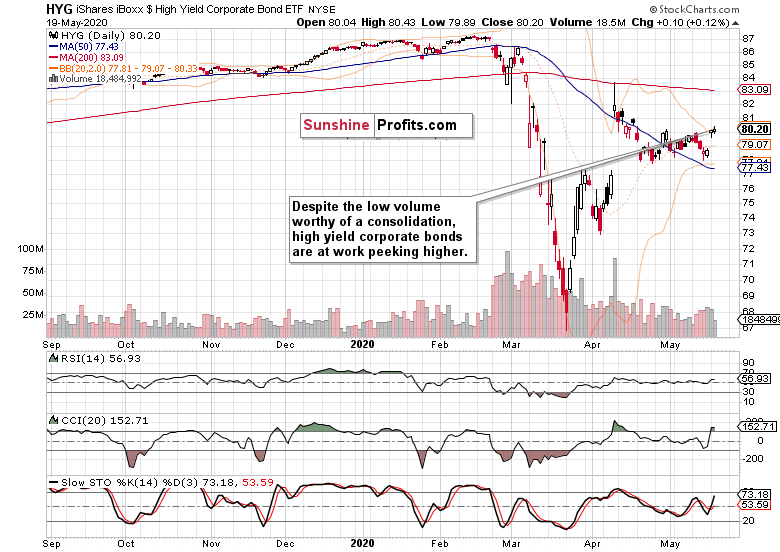
Absolutely not. High-yield corporate debt (HYG ETF) kept its opening gains, and merely gave up some intraday ones. That’s a short-term sign of outperformance, meaning the stock bulls have the wind in their sails.
Just as with stocks, yesterday’s HYG ETF upswing happened on low volume, hinting that this hasn’t been the real deal yet. It’s likely just a consolidation before another corporate junk bonds upleg, in our opinion.
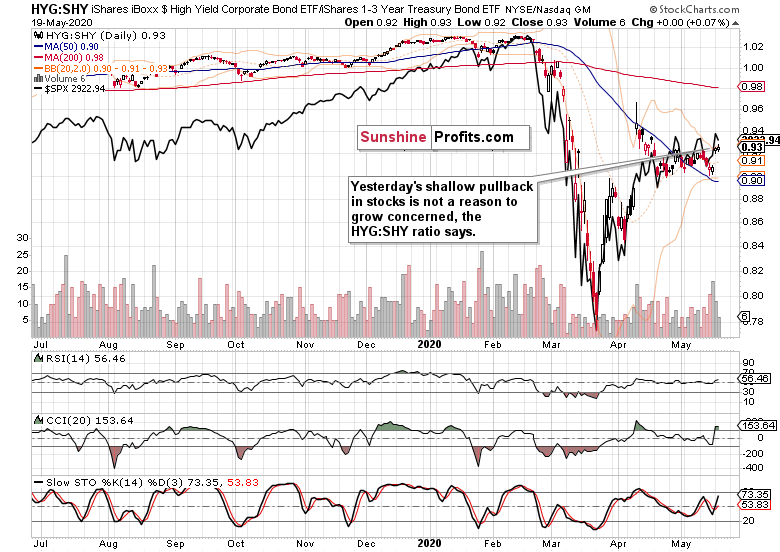
The high-yield corporate bonds to short-term Treasuries ratio (HYG:SHY) also confirms our view that yesterday’s shallow pullback in the overlaid S&P 500 chart (the black line), has been no game changer.
Key S&P 500 Sectors in Focus
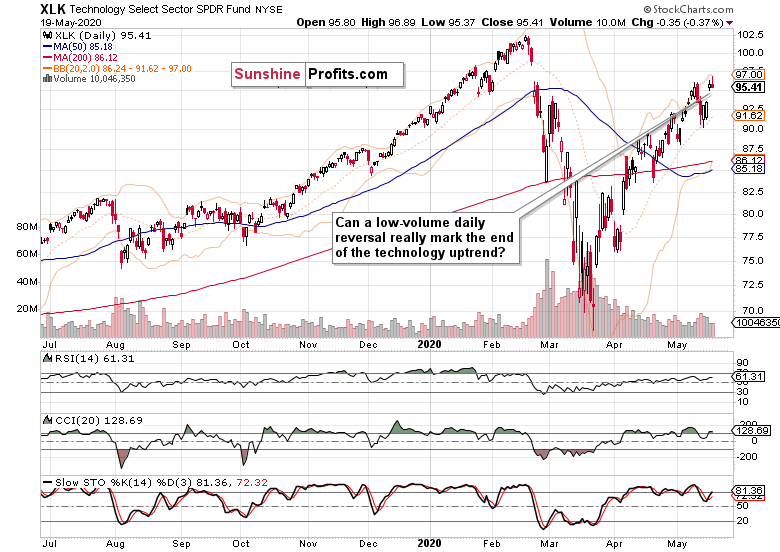
Technology (XLK ETF) gave up its intraday gains, and reversed lower on a not-so-outstanding volume. In other words, its uptrend is intact – just look at the volume around last week’s lows compared with previous two days’ one. While the accumulation at the lows hadn’t been above the volume of Wednesday’s plunge, it has still been more pronounced than the distribution just seen. Coupled with the daily indicators’ posture, that’s another reason for why the march north will likely go on.
Healthcare (XLV ETF) declined yesterday, but remains pretty much range-bound.
Financials (XLF ETF) also moved lower yesterday, but its indicators support another move higher as the sector appears getting ready to move clearly above the midpoint of its April range.
Despite the ominous daily reversal candle with sizable upper knot seen in the consumer discretionaries (XLY ETF), the sector didn’t decline on outrageous volume. In other words, its move is consistent with merely a daily setback suffered. Importantly, it outperformed its defensive counterpart, the consumer staples (XLP ETF), which declined on the day – just as utilities (XLU ETF) did.
Among the stealth bull market trio, both energy (XLE (NYSE:XLE) ETF) and materials (XLB ETF) gave up most of Monday’s gains, with industrials (XLI ETF) holding up best. The volumes behind yesterday’s declines within these three sectors don’t mark a reversal either. Again, it’s consistent with only a daily setback seen.
By the way, not even on yesterday’s housing data coming in below expectations (yes, we mean the key ones – the actual housing starts), the real estate sector (XLRE ETF) didn’t sell off dramatically. Its performance actually mirrors that of the financials, which shouldn’t really be all that surprising.
From the Readers’ Mailbag
Q: Do you think the "real economy bottom" is at hand? With 20% unemployment, massive debt, multiple small business failures, and a still raging virus, I would question that perception.
A: Well, if you count those who (almost magically) dropped out of the workforce, we’re well over 20% unemployment. New jobless claims are one part of the story, but the continuing unemployment claims are more important. Sure, if you look around and see the retail sales, they are out of a horror show. But company earnings (prospects) have slowly started to turn the corner already.
Sure, the brick-and-mortar retail sector is suffering and among many other household names, JC Penney (NYSE:JCP) filed for bankruptcy. But please remember that these are beached whales that have been massively overbuilding well before the great financial crisis struck. The US simply has the most square feet per capita in the world, so the coronapocalypse is the straw that’s breaking the camel’s back here. Among the destruction though, creativity and online solutions in the sector abound – we’re not looking at Amazon (NASDAQ:AMZN) here.
But I agree that small business, the backbone of US economy, is suffering, and unfortunately will continue to do so. With the way the S&P 500 is structured (the weighting of the behemoths and importance of foreign sales especially should the dollar roll over – in my humble opinion, it will later this year), the index can continue higher still though, and probably more vigorously than the Russell 2000 (IWM ETF).
I also agree that we’re in the ebbing stage of the virus, and the risk of a second wave is still very much there – regardless of the relative complacency that rules the day.
But still, the market perception, its discounting mechanism, is what counts. And the S&P 500 is very much willing to bridge the valley. Remember early April when Fauci was talking lockdown here, there, everywhere? The index obliged lower but just couldn’t decline any more for several days, while we still saw the exponential rise in infections and were waiting for another shoe to drop. It didn’t happen, and unless we see the June data (continuing unemployment claims, participation rate, retail, manufacturing and the like) coming in lower than those of May, the stock market is unlikely to sell off more than a couple of percent and enter a bear market territory (which is defined by a more than 20% decline).
Also, the sentiment data don’t favor a really deep downswing – there are just too many bears out there. The forward-looking volatility measure, the VIX, also supports the stock upswing to continue, as its increases are associated mostly with stock selloffs. That’s because stocks usually decline faster than they rise (we saw that yesterday on intraday basis). Look at the VIX, it’s been trending lower, making a series of lower highs and lower lows since mid-March.
In closing, the real economy is just one factor in the S&P 500 equation, and you’re right the real economy bottom might not have yet been reached. I agree, this is a mini-depression, and we’re bound to find out what mini actually means in terms of time. Yet, it’s the green shoots (e.g. the slowing pace of manufacturing’s decline – see the Empire State Manufacturing Index) that stocks are acting upon (similarly to how they did in March and April 2009), and we have to deal with the stocks’ perceptions first of all here.
Summary
Summing up, yesterday’s decline into the closing bell didn’t materially change the bullish perspective in stocks or upturn the credit markets. Corporate debt continues being supportive of the stock upswing, and the unfolding breakout (rigorously speaking, it takes preferably three sessions’ closes higher to declare it confirmed) above the 61.8% Fibonacci retracement is likely to succeed this time. Thereafter, the bulls would target the 200-day moving average at around 3000. As outlined on Monday, while we don’t expect a sizable selloff, we don’t see dramatic gains as overly likely either. The best-known measure of volatility, VIX, appears to support the bullish view over the coming weeks.