When our covered call positions end up moving deep in-the-money, we are faced with the decision to close as our maximum profit has been realized or take no action and allow assignment. In October 2017, Andrew shared with me a trade he successfully executed and was faced with such a dilemma.
Andrew’s trade with Ultra Clean Holdings Inc (NASDAQ:UCTT)
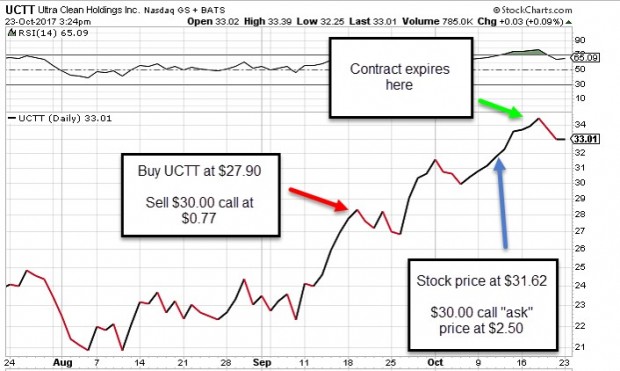
- 9/20/2017: Buy UCTT at $27.90
- 9/20/2017: Sell $30.00 Oct. 20th call at $0.77
- 10/11/2017: UCTT trading at $31.62
- 10/11/2017: “Ask” price for the $30.00 call traded at $2.50
Let’s view this trade graphically:

The question at hand is whether it is too expensive to close at $2.50…to close or not to close!
Andrew’s initial and now maximized trade

The Ellman Calculator shows a total maximum return of 10.3% (2.8% + 7.5%). This 1-month return will be realized as long as share value remains above $30.00.
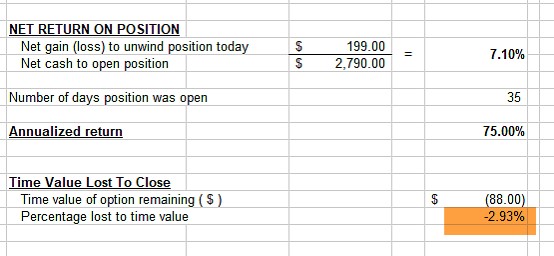
Time value cost-to-close using the Elite version of the Ellman Calculator (Unwind Now tab)

The “Unwind Now” tab of the Elite version of the Ellman Calculator shows a time value cost-to-close of 2.93% based on current share value of $30.00. Let me break this down based on calculations after the option is bought back:
- Share appreciation: $31.62 – $27.90 = + $3.77
- Option credit: $0.77
- Option debit: (-) $2.50
- Net credit: $1.99
Percentage lost to time value:
- Cost-to-close: (-) $2.50
- Share appreciation as a result of closing short call: $31.62 – $30.00 (strike price) = + $1.62
- Net debit = (-) $0.88
- Cost basis is $30.00 (current value of UCTT due to strike in place
- Time value lost: $0.88/$30.00 = 2.93%
Analysis
Closing mid-contract
In order to justify spending 2.93% to close, we must be able to say that investing the proceeds from the sale of the stock will result in a return at least 1% higher then 2.93%. With only 8 trading days remaining until contract expiration, this is highly unlikely.
Allowing assignment
As long as share value does not decline by more than 5.4% ($1.62/$30.00) in the next 8 trading days, we will have realized our maximum 10.3%, 1-month return. Many times, the best action is no action at all. If share value continues to rise and the time value cost-to-close approaches zero, we can re-evaluate and possibly take action. As expiration Friday approaches, we can also evaluate for possibly rolling our options.
Discussion
When share price accelerates substantially and we cannot benefit any more from share appreciation positions can be closed based on the time value cost-to-close. We will spend the money if the cash generated from selling the underlying can generate a higher return than the cost-to-close by at least 1%.
Market tone
This week’s economic news of importance:
- Markit manufacturing PMI April 56.5 (55.6 last)
- Markit services PMI April 54.4 (54.0 last)
- Existing home sales March 5.60 million (5.52 million expected)
- Case-Shiller home prices Feb. 6.3% (6.1% last)
- Consumer confidence index April 128.7 (125.9 expected)
- New home sales March 694,000 (630,000 expected)
- Weekly jobless claims 4/21 209,000 (230,000 expected)
- Durable goods ordered March 2.6% (3.5% last)
- GDP Q1 2.3% (2.0% expected)
- Consumer sentiment index April 98.8 (98.0 expected)
THE WEEK AHEAD
Mon April 30th
- Personal income March
- Consumer spending March
Tue May 1st
- Markit manufacturing PMI April
- ISM manufacturing index April
- Construction spending March
Wed May 2nd
- ADP employment April
Thu May 3rd
- Weekly jobless claims through 4/28
- Trade deficit March
- Productivity Q1
- Markit services PMI April
- ISM nonmanufacturing index April
- Factory orders March
Fri May 4th
For the week, the S&P 500 moved down by 0.01% for a year-to-date return of (-) 0.14%%
Summary
IBD: Uptrend under pressure
GMI: 4/6- Buy signal since market close of April 18, 2018
BCI: Selling 2 in-the-money strikes for every 1 out-of-the-money strike for all new positions. Earnings season is solid so far.
WHAT THE BROAD MARKET INDICATORS (S&P 500 AND VIX) ARE TELLING US
The 6-month charts point to a bearish sentiment. In the past six months, the S&P 500 was up 2% while the VIX (15.40) moved up by 50%. The VIX has subsided a bit more from the last week.
Wishing you much success,
