It has been at least a few weeks since I’ve updated the blog and the newsletter properly. I have finally finished my trip traveling through Asia and now find myself back in the office doing the work I love so much.
I would like to thank all of the incredible people I have met on this trip, as well as existing friends with which I had an amazing time. I personally really enjoyed Seoul, South Korea quite a lot. I also have some plans in the future to travel to North Korea as well, which should be extremely interesting.
The blog posts will be back now, with a lot of action throughout the week!
Equities
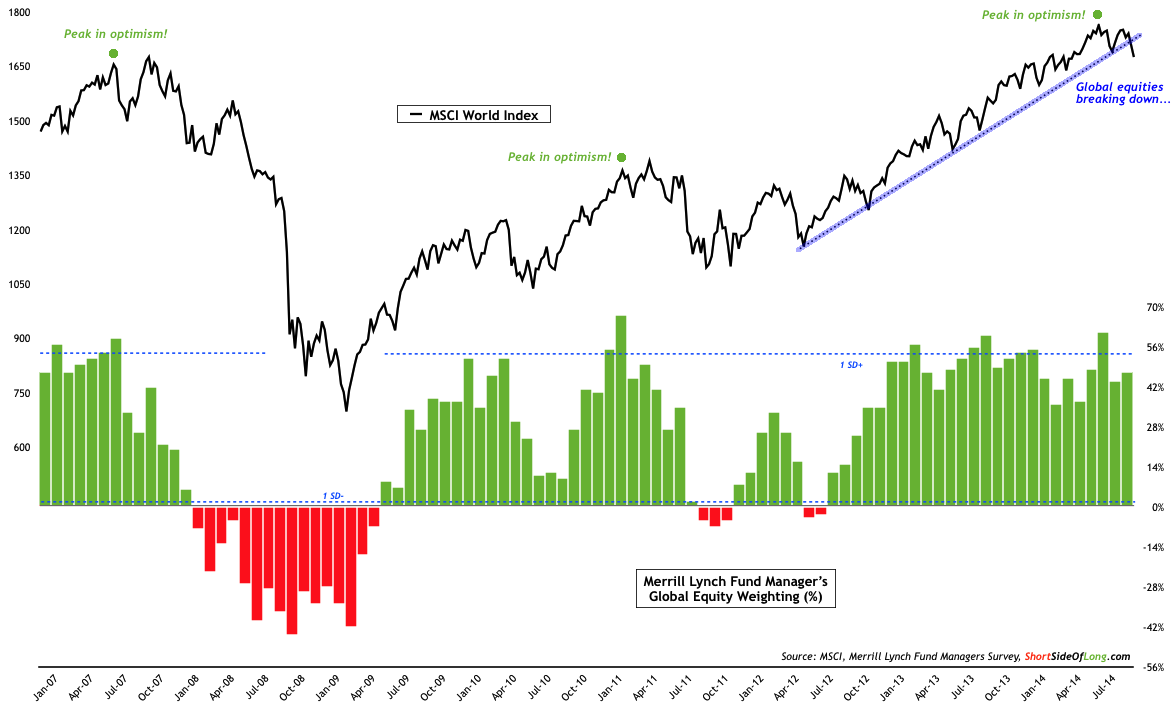
Chart 1: Fund managers have started to reduce their exposure in stocks
- This months Merrill Lynch Fund Manager Survey equity exposure came in at 47% overweight, relative to last months reading of 44%. Two months ago, global fund managers have pushed their exposure towards stocks at the second highest level in surveys history at 61% overweight. Since then we have not seen that much downside reaction in US equities (apart from small caps which I have been shorting), but downside has been evident in European markets, GEMs markets and even REITs. All of this is pushing the MSCI World Equity Index to break its uptrend. As we can clearly see in the chart above that fund manager positioning has not reached levels of fear usually associated with a contrarian buy signals, so maybe this is a sign that a more meaningful correction is just getting underway.
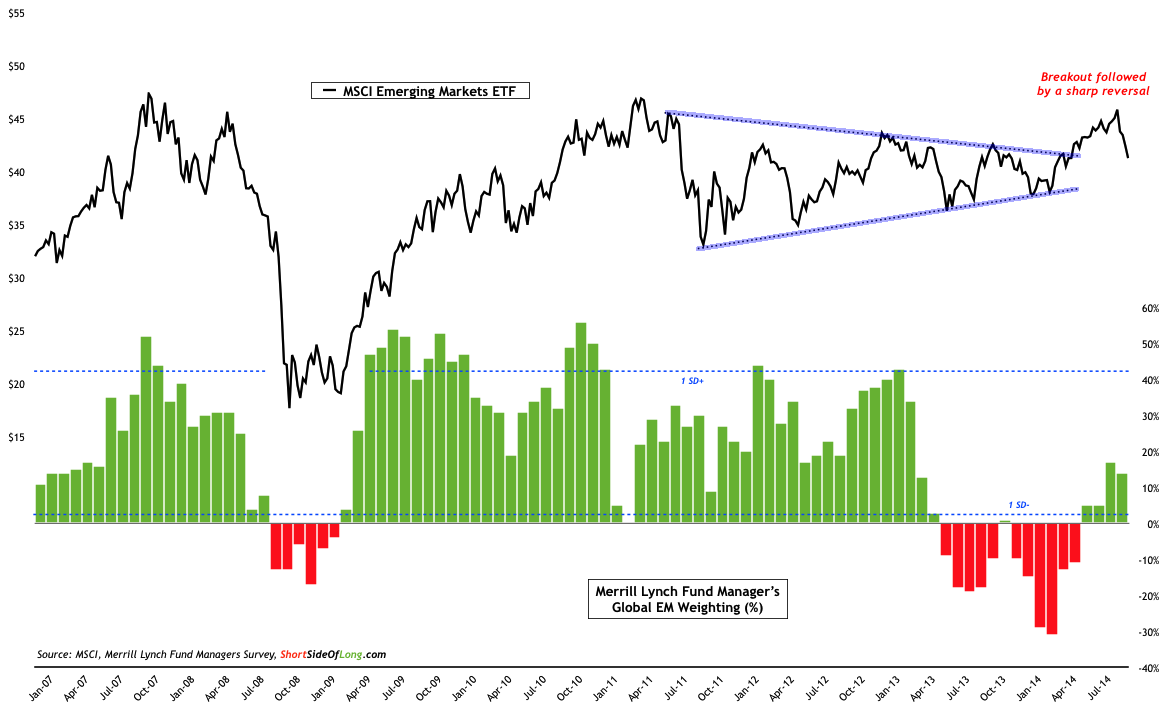
Chart 2: Emerging markets are not looking that healthy in recent weeks!
- This months Merrill Lynch Fund Manager Survey GEM equity exposure came in at 14% overweight, relative to last months reading of 17%. Interestingly, at the beginning of the year we saw a huge underweight by global fund managers in emerging market equities, from which the MSCI EM Index rallied strongly and eventually leading to a breakout from a prolonged consolidation (observe Chart 2). However, the recent sell off in global equities has also impacted EM space as well and now the breakout is starting to look like a bull trap with a potential of more downside. Perfect example is Hong Kong’s HSI, which has now reversed all of its recent gains and looks rather bearish.
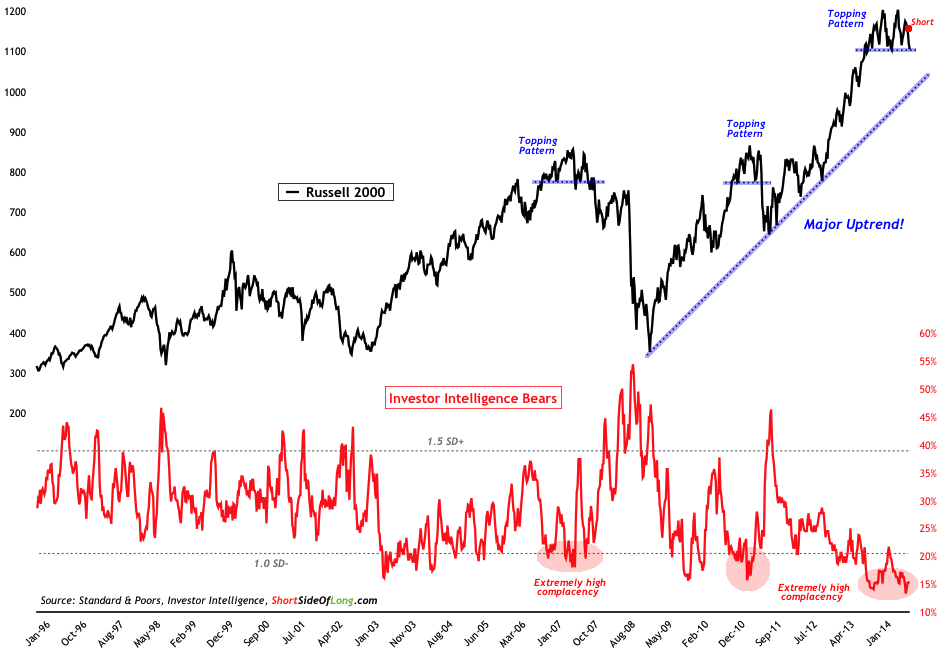
Chart 3: US small caps could now be forming a more meaningful top!
- Summarising various the equity sentiment survey readings for the month, we can observe in the chart above that despite the fact that bullish sentiment readings aren’t extreme or exuberant, we continue to see complacency rule. Russell 2000 started its topping pattern as Federal Reserve announced its taper program at the beginning of the year. The index has recently failed to confirm new highs with S&P 500 and Dow Jones, as it seems that small caps are struggling with reduced liquidity. As already mentioned on my blog, I have been short the small cap index since middle of September, with a tight stop loss and expect possible further downside as long as there is a lack of bears (Refer to Investor Intelligence chart above). Majority of the other sentiment surveys such as Consensus Inc, Market Vane and NAAIM also portray a similar condition where bulls aren’t extreme, but investors still do not fear a major stock market fall.
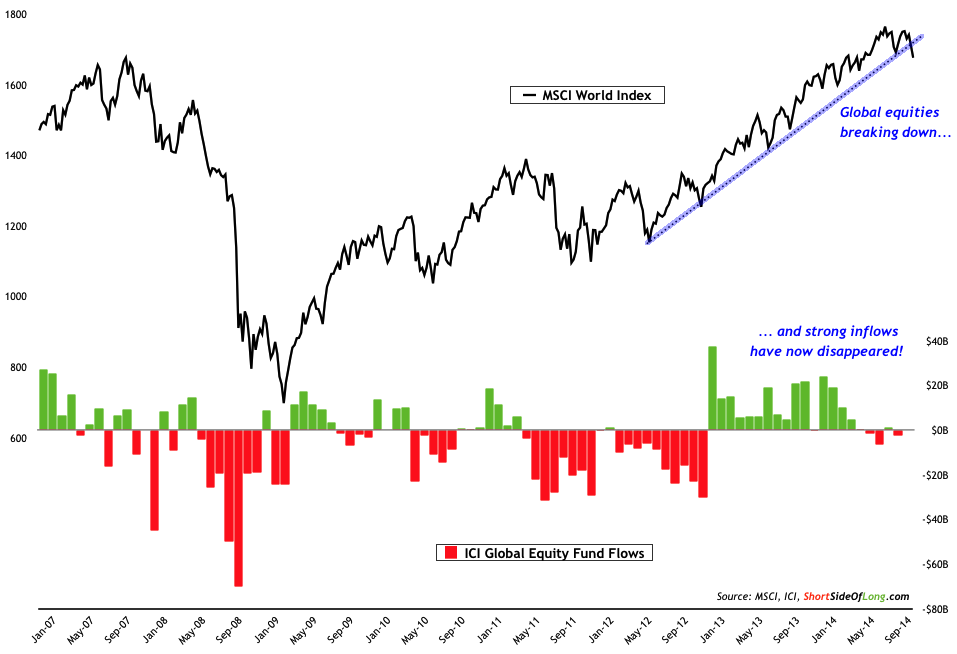
Chart 4: 17 month streak of stock inflows seems to be coming to an end
- This month’s fund flows report by ICI showed global equity funds continue to show below average exposure towards equities, with some monthly outflows. After a super run in 2013, where we saw 17 monthly inflows in the row, some selling has taken place with the last 3 out of 4 months being negative. It is true that outflows haven’t been anywhere as extreme as they were during 2011/12 period, nevertheless this could be a sign of things to come. After all, referring to Chart 4, we clearly see a price break down from an uptrend that started in early 2012. Are we finally ready to mean revert and work off some of the gains we have seen in recent quarters?
Chart 5: Financial stress is starting to rise within the market conditions
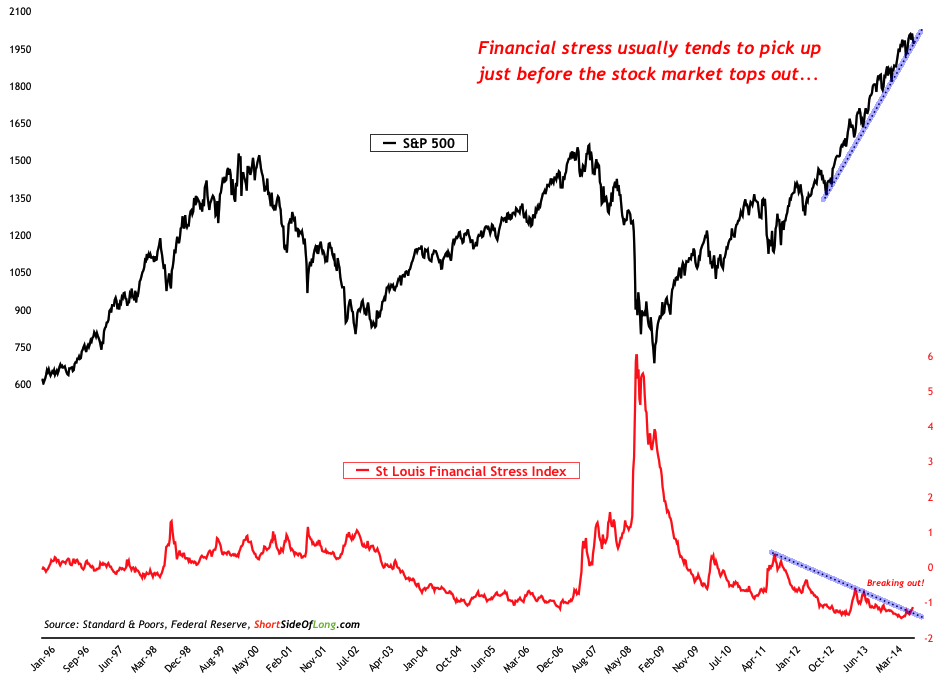
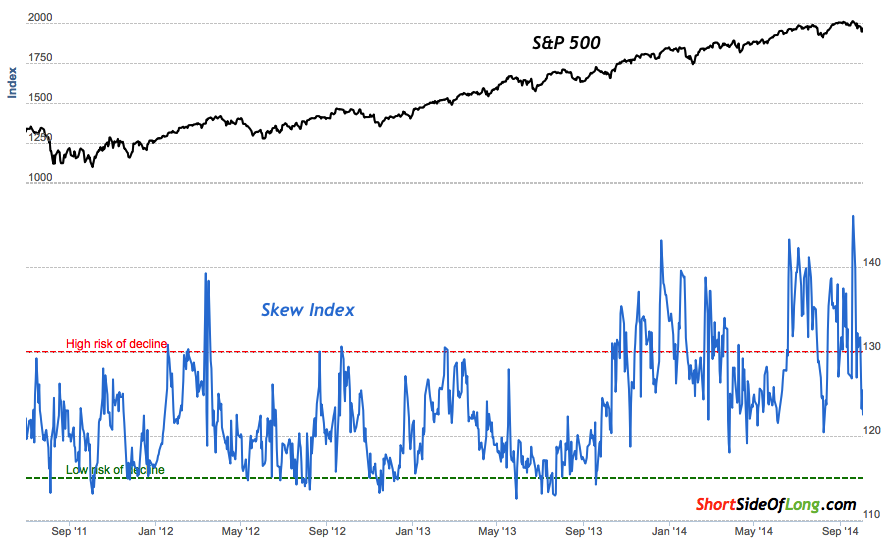
- Summarising this month’s options & volatility conditions, it is worth saying that volatility has picked up in recent weeks as I was away on my trip. First we started seeing volatility rise in currencies, which was later followed by commodities. This is now spilling over into certain parts of equity market and eventually it might even affect the bond market (especially in Eurozone). It seems that not all is well with the markets and most likely with the global economy. St Louis Financial Stress Index is now also picking up and breaking out on the upside (refer to Chart 5).Various credit spreads are also an indication there could be trouble ahead. This is definitely a worrying sign, and together with the elevated Skew Index (see the chart below), it seems that options traders are starting to price in some risk. Caution is advised.
Chart 6: Options traders continue to price a probability of a large decline
Source: SentimenTrader (edited by Short Side of Long)
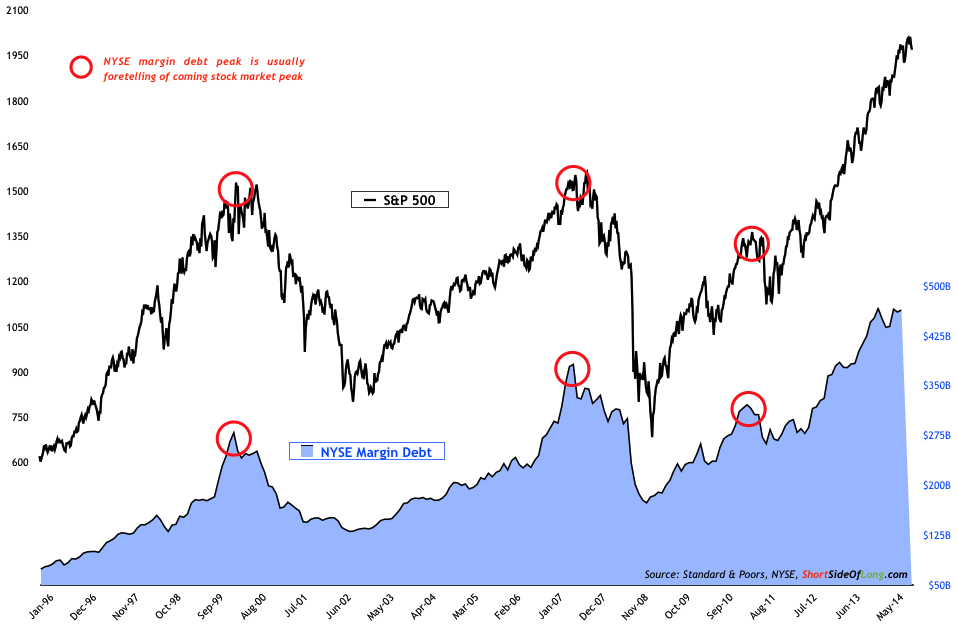
Chart 7: Leveraged players remain long stocks hoping for more gains…
- According to NYSE’s latest monthly report, investor margin debt increased by less then $3 billion to $463.02 billion. Majority of the market participants look at this indicator for clues regarding a possibility of a market top. Thinking goes along the lines that historically, margin debt tends to peak out several months before the stock market tops. While this has been true in 2000 and 2007, it did not work always work so well (remember that no indicator is perfect). Personally, I think what is more important is to cross-reference indicators together. For example, even though leveraged players remain long the stock market with hopes of more gains to come, various other indicators are currently warning us of a possible correction ahead (including stock market breadth not discussed in this article).
Cash & Bonds
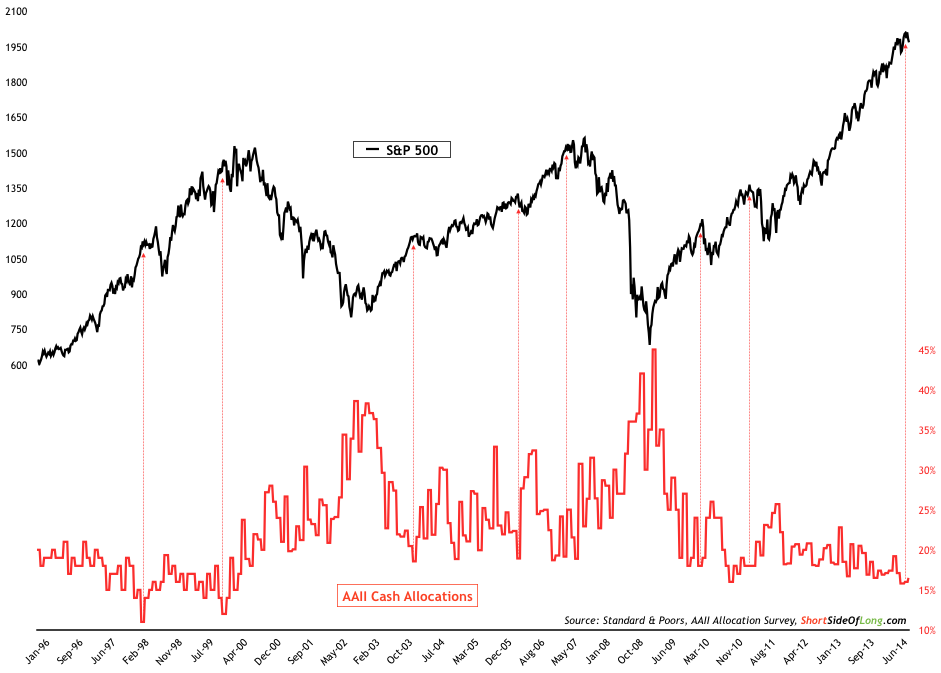
Chart 8: Retail investors continue to hold incredibly low levels of cash!
- Recent monthly AAII Asset Allocation Survey cash exposure rose only ever so slightly towards 16.5%, compared to last months reading of 16.0%. I have stated this before and it is worth saying it yet again: usually low cash levels have almost always signalled intermediate stock market peaks and eventually this “teflon market” will be impacted like others have. Moving along to other cash indicators, this months Merrill Lynch Fund Manager Survey cash exposure remains decently high at the level of 4.6% (usually I regard a sell signal around 3.6% and a buy signal at 5.0%). The question is why are fund managers cash levels so high and yet the US market has barley corrected? Personally, I think the answer is linked to weakness in various other global assets, with US the only out-performer.
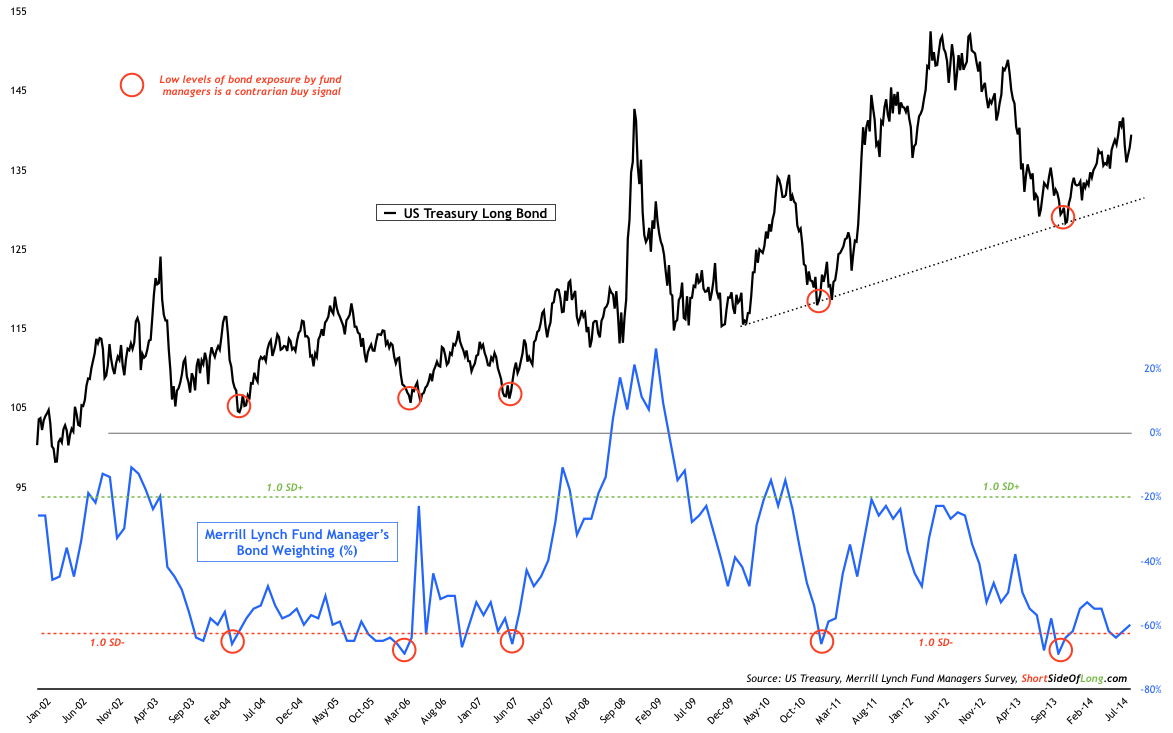
Chart 9: Funds refuse to overweight bonds in anticipation of rate hikes
- This months Merrill Lynch Fund Manager Survey bond exposure came in at 60% underweight, relative to last months reading of 62% underweight. We have seen an interesting divergence between a rally in bonds and reluctance of exposure towards them by fund managers for majority of 2014. My personal take on this is that fund managers continue to expect an interest rate hike by the Federal Reserve and therefore remain heavily underweight bonds, similar to the last business cycle between 2003-07 (clearly seen by referring to the chart above).
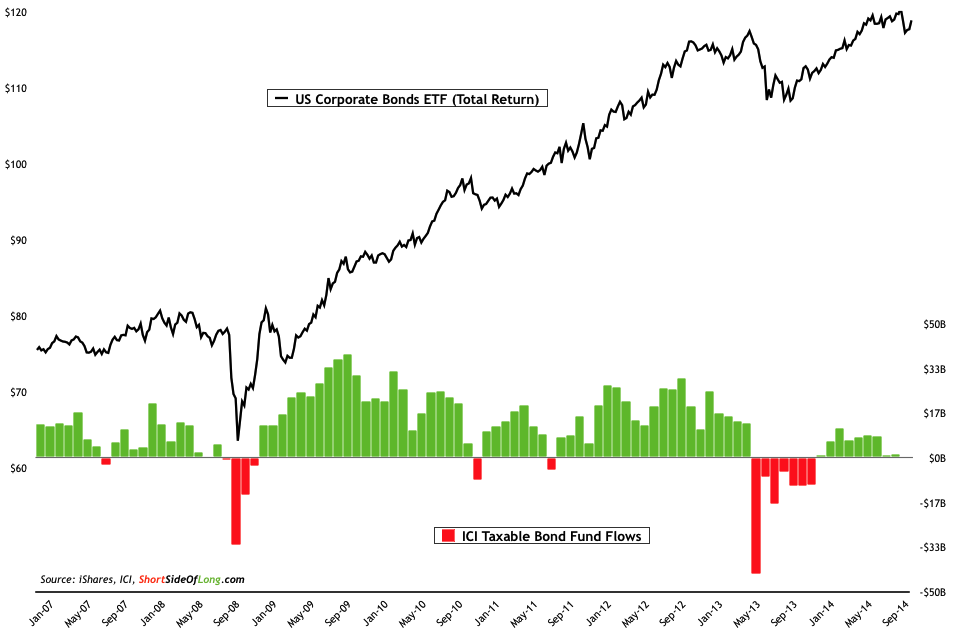
Chart 10: Bond fund inflows have started to stalled in recent months…
- This month’s fund flows report by ICI showed taxable bond funds had estimated inflows of only $1.28 billion for the month of September. This compares to a total estimated inflows of only $1.15 billion for the month of August. It seems that fund flows for both stocks and bonds have slowed or even stalled in recent months. Are market participants worried about the end of yet another QE program and a potential Fed rate hike? It seems that at least some investors are acting rather cautiously with new money right now.
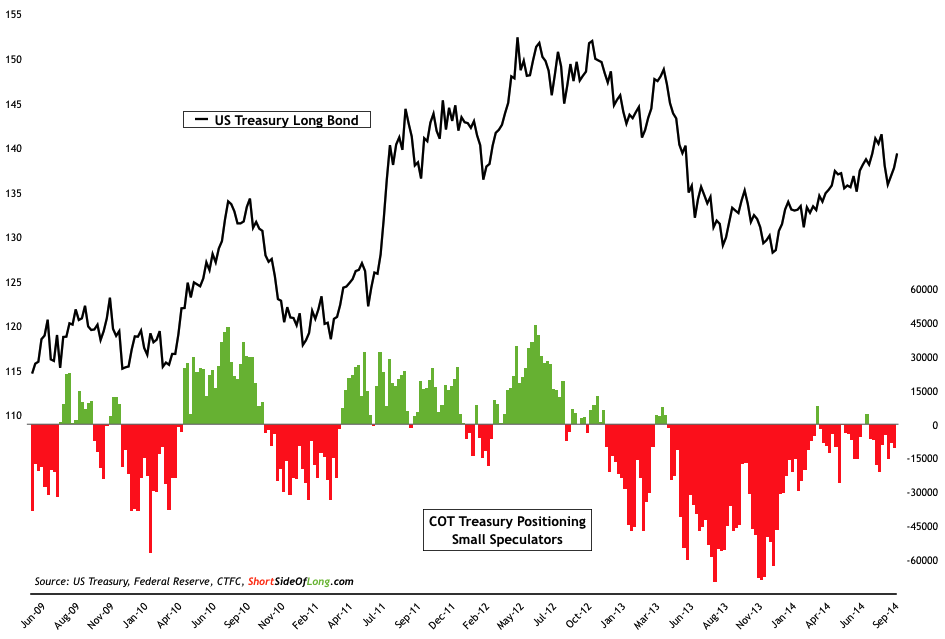
Chart 11: Speculators continue to hold small bearish bets on Treasuries
This month’s commitment of traders reports shows that small speculators still remain slightly bearish on the Treasury Bond market. If we refer to the chart above, we can see that current contracts stand at -10,344 net shorts. This compares to last months reading of -8,956 net short contracts. This is a far cry from pessimistic positioning seen at the end of 2013, or for that matter the optimistic positioning seen in middle of 2012. I have been very surprised by small speculators (dumb money) and their reluctance to chase the bond market prices higher. We haven’t seen any meaningful long positions since the middle of 2012 and it’s as if the huge outperformance by Treasuries has been completely missed by the majority this year.
Commodities
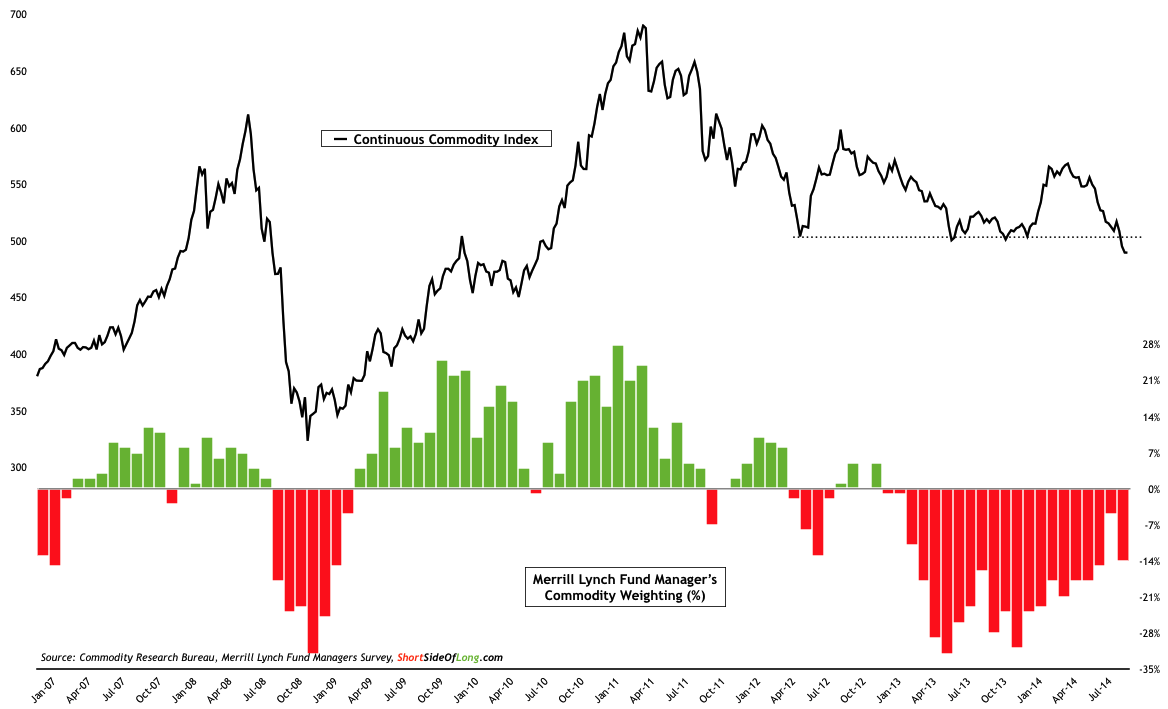
Chart 12: Managers are starting to get bearish on commodities again…
- This months Merrill Lynch Fund Manager Survey commodity exposure came in at 14% underweight, relative to last months reading of only 5% underweight. It seems that global fund managers jumped on the commodity rally that occurred in first half of the year, however their timing terribly lagged the actual price. Consider that by August the survey found global fund managers to be only 5% underweight commodities – quite a bullish stance relative to last couple of years. At the same time, the price of all major raw materials was already slipping and to this day it still continues to do so. Now we find that allocations are a long way from panic extremes and yet commodities are breaking down towards 5 year lows. This could signal potentially more downside to come before sentiment gets bearish again.
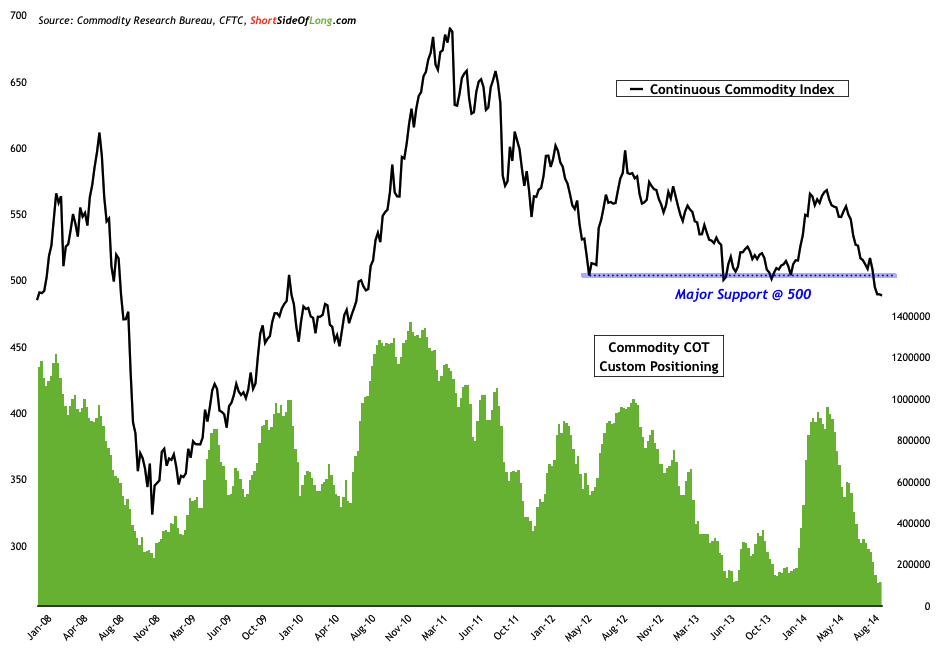
Chart 13: Commodities are breaking down as funds rush out for the exit!
This month’s commitment of traders reports showed that hedge funds and other speculators still continue to cut their net long exposure towards commodities. Custom COT total contracts currently stand at 115,860 net longs, compared to last months reading of 260,470 net longs. As commodity prices break their major support level, hedge funds are rushing for exits. We are now getting very close to a condition where hedge fund community might turn net short on raw materials, something which we didn’t even see during the Lehman panic.
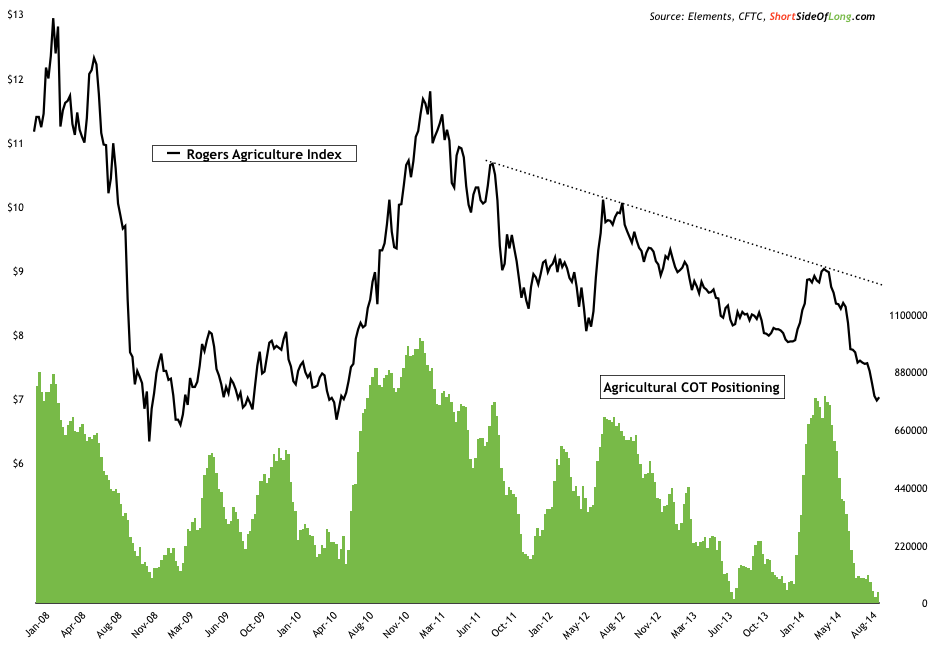
Chart 14: Agricultural price downtrend since ’11 as funds sell everything
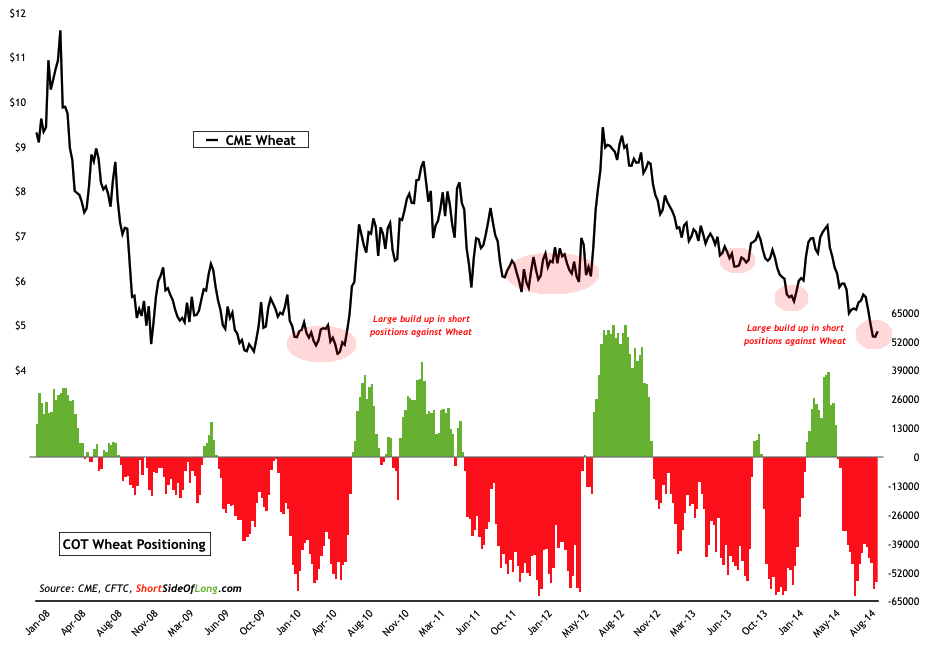
Agricultural commodities have been slaughtered since May of this year. Whether we are looking at grains or softs, just about everything has fallen in dramatic fashion. The only survivor seems to be Coffee, which has done quite well due to major supply issues coming out of Brazil. Observing the Rogers Agricultural index, which is probably the most balanced of all Ag indices, it has been under huge selling pressure in the last 3 months and still remains in a downtrend since early 2011 (approaching four years now). The recent sell off is definitely looking like a liquidation, which from a contrarian point of view usually (but not always) marks a major low. Judging by the COT positioning, bulls have been completely shaken out and in certain cases like Wheat (refer to chart below) short bets are incredibly high! A tradable rally could be just around the corner!
Chart 15: Short bets on Wheat are at levels associated with major lows!
Currencies & PMs
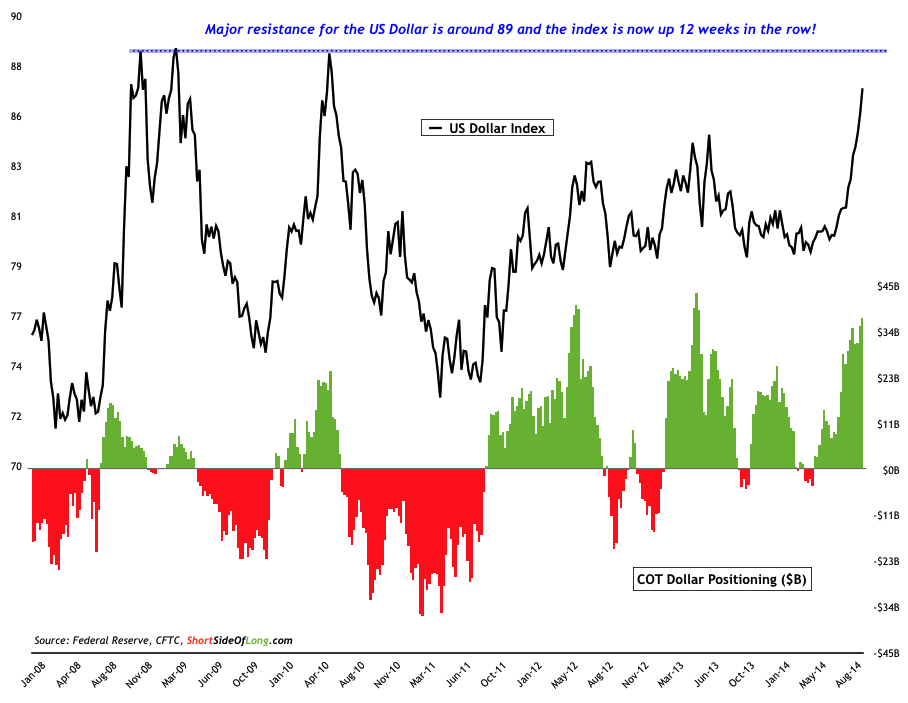
Chart 16: US Dollar Index is up 12 weeks in the row & funds are pilling in
This month’s commitment of traders reports have shown a huge increase in positioning towards the US Dollar. Custom COT total seen in the chart above currently stands at $37.1 billion of net long contracts, compared to three months ago when it stood at only $7.8 billion of net long contracts. Majority of the greenback bullish bets are coming from the Euro and Yen shorts, while speculators are now also turning bearish on the commodity currencies too. The US Dollar Index has rallied for 12 straight weeks and is fast approaching a major resistance zone around 89. While further upside towards resistance is possible in the short term, I would argue that the greenback will soon be going through a correction or consolidation period.
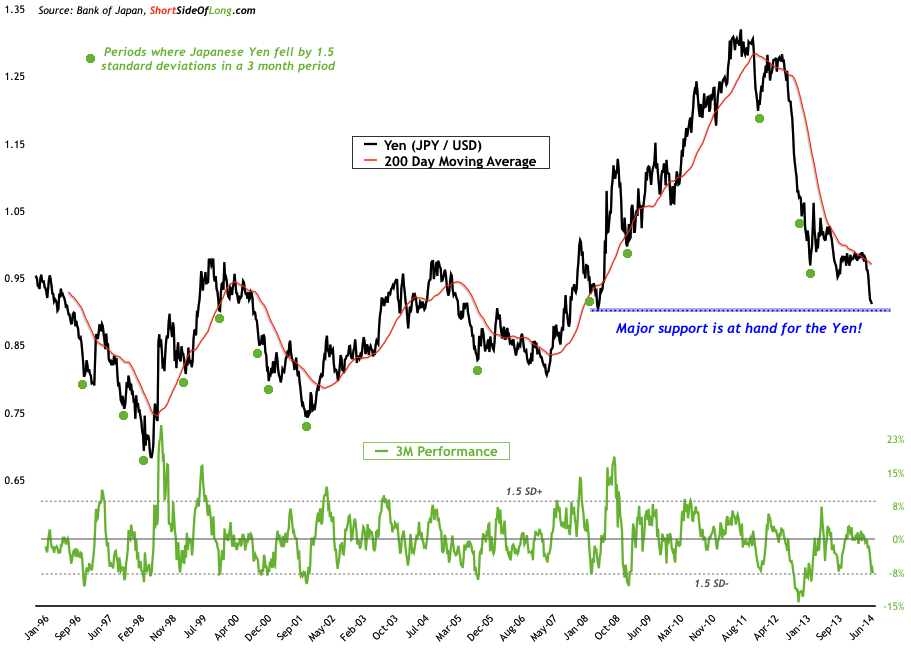
Chart 17: Yen is extremely oversold & approaching an important support
- If you have been a regular follower of this blog, you would have noticed a consistent focus on the Yen over the last few months. This is because I believe that a major rally in a form of a short squeeze could be at hand. The currency is down -7.7% over the last 3 months alone (refer to chart above) and over -30.1% in the last 36 months or 3 years. This indicates extremely oversold conditions from which a rebound could occur (note that no indicator works 100% of the time). Furthermore Yen now finds itself at an important support level, while sentiment surveys and short contracts on the currency are signalling extreme negativity. Everywhere I’ve been on my trip and everyone I talked to loves to hate the Yen right now (apart from only one person), therefore over the coming days or weeks I might just do the opposite and buy the currency.
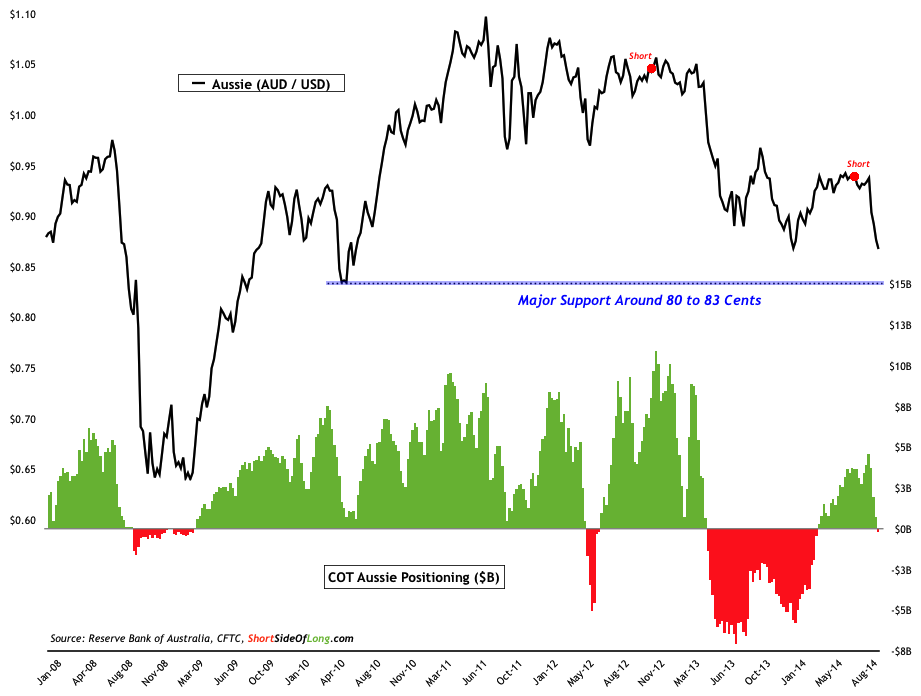
Chart 18: Australian Dollar has fallen sharply over the last few weeks…
- Over the last 12 weeks, we have been in a period of universal Dollar strength and it seems that nothing has been spared. Therefore, it also shouldn’t be surprising to see the Australian Dollar under strong selling pressure, similar to majority of the other global currencies. I originally shorted the Australian Dollar all the way back in late 2012 as hedge funds held record bullish bets on the currency. As a wise man once taught me “when everyone is on one side of the boat, you should go to the other side for a while.” I added to those positions recently as hedge funds started buying the Aussie yet again around 94 cents and have been lucky to catch a mini-crash in recent weeks. The currency is now approaching a major support level, which is between 80 to 83 cents (80 cents is multi-decade important pivot). I do not know if we will get there but if we do, I just might consider covering my shorts.
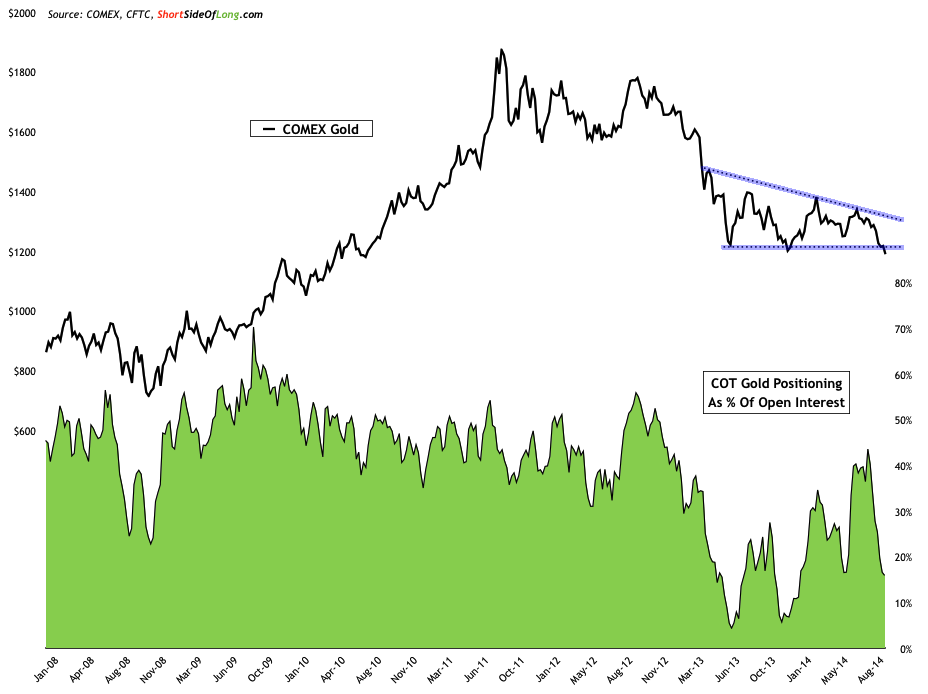
Chart 19: Gold is breaking below the important support level at $1,200
This month’s commitment of traders reports have shown continual and steady decrease in Precious Metals net long positioning. Gold COT stands 60,729 net long contracts (16% of OI) for the month of September, compared to last months level of 103,707 (28% of OI). In the Silver market, COT stands at 15,461 net long contracts (9% of OI), compared to last months level of 32,295 (20% of OI). I warned time and time again that a huge build up in net long positioning around July will most likely lead to further downside as the PMs bear market is not yet finished and as we can clearly see from the chart above (and below) both Gold and Silver are now breaking their major support zones.
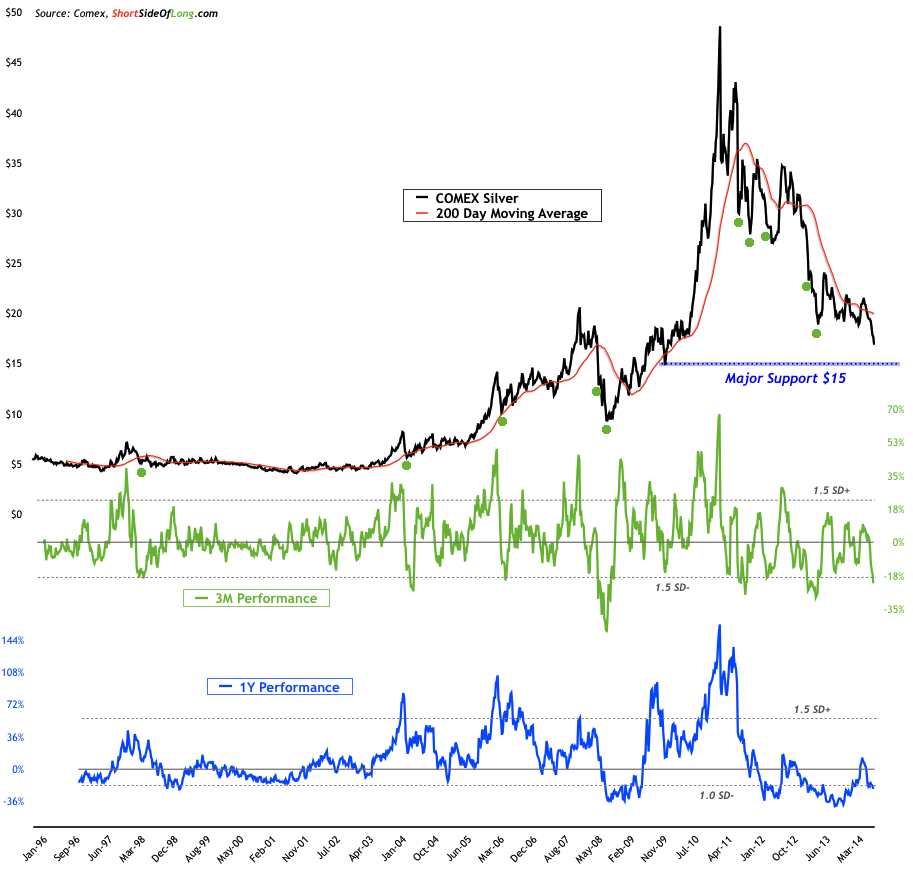
Chart 20: Silver is now 66% from its all time high and extremely oversold
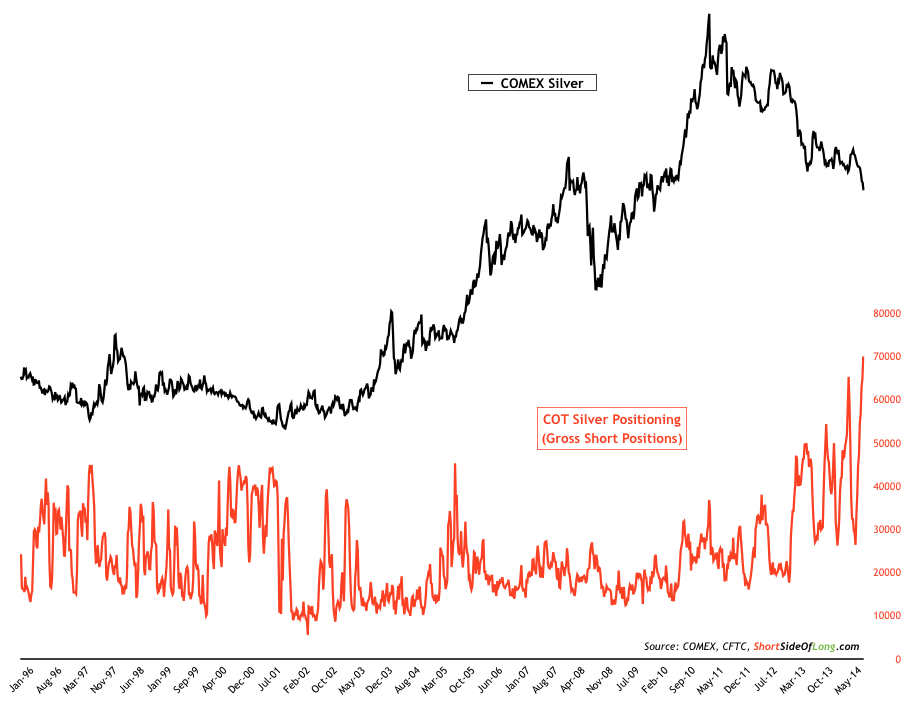
While sentiment and futures positioning in Gold is not yet at major extremes associated with a buying opportunity, Silver is kind of getting there. Now, that doesn’t mean that Silver’s sentiment won’t get even worse before the price puts in a proper low. As we can clearly see from the chart above, a major support zone sits around $15 per ounce and we might just get there in coming months. However, also keep in mind that the metal is already extremely oversold as its down 22% over the last 3 months and 66% over the last 3.5 years. Furthermore, hedge funds are in major group-think mode on Silver, with short bets reaching yet another record high. So, I am honestly thinking that a short squeeze could occur at anytime in this metal.
Chart 21: Short positions are once again at record highs in Silver market

